Alan Mearns
Senior
Staff Scientist
and Leader of the Biological Assessment Team at NOAA's
HazMat Division, SeattleOffice of Response and Restoration
National
Ocean Service
National Oceanic and Atmospheric Administration
7600
Sand Point Way NE
Seattle, WA 98115
A Lecture Presented for Fish 497U
Questions Addressed (Outline)
This is a very
brief overview of pollution studies and highlights in Puget Sound, but it
includes some recent important trend information.
Pollution is a
damaging excess of contaminants. Contaminants are any biological,
physical or chemical agents that occur in excess of the their natural
range. Human bacteria, light, noise, suspended particulate material, and
various chemicals are contaminants. This summary focuses on chemical
contaminants. Federal, state and local agencies conduct monitoring and
assessment surveys to map and document contamination and effects of
contaminants on marine and aquatic biota. Materials which we consider
contaminants can enter the Sound from a wide range of sources including
transport from the ocean (advection), rivers and streams, shoreline
erosion, urban runoff, permitted industrial and municipal discharges,
combined serer overflows and atmospheric fallout. Water, sediment and
marine life in large areas of the greater Puget Sound area are clean or
slightly contaminated and do not harbor marine life injured by
contaminants. However, most urban and rural bays contain water, sediments
and/or biota with low levels of various chemical contaminants. In some
areas, such as urban waterways, concentrations of contaminants are high
enough to injure marine life, shellfish and fish, including juvenile
salmon.
In past decades Puget Sound sediments, water and biota were considerably more contaminated, and over a larger area, than they are today. Dated sediment cores reveal that the bottom of Puget Sound was clean until just after the turn of the century. The most contaminated period was between World War II and about 1960 when many kinds of metals and organic chemicals were discharged and spread through the shallow and deep waters of the Main Basin. Laws and enforcement actions during the 1960's began to reverse this trend. Pulp mills reduced their waste inputs by factors of 10 or more. During the 1970's pre-treatment, source controls and bans on chemicals such as DDT , PCB's and leaded gasoline caused further and dramatic reductions in the amounts of contaminants entering the Sound. Actions during the 1980's and 1990's help control contaminant inputs from old plumbing, hazardous waste sites and other hot spots. During the late 1980's and into the 1990's increased levels of wastewater treatment were implemented.
Challenges for the future include completing cleanup of hotspots, improving prevention and/or cleanup of oil and chemical spills, reducing inputs from combustion and understanding and, if necessary, controlling contamination of rivers, lakes and streams.
VIEWGRAPHS
1. OVERVIEW : RESPONSE AND RESTORATION
2. HAZMAT APPROACH AND RESPONSE QUESTIONS
What got spilled?
Where is it going?
Who
gets hit?
How does it hurt?
So what and how should we respond?
The goal of response, clean-up, pollution control should be to make things better, improve the chance for natural restoration, etc. Over-reacting can make things worse.
1. An effective response requires good knowledge about hazardous materials. What chemical form? Are they biologically reactive, available? How toxic are they? Do they change, weather, over time?
2. Resources are not affected unless they are exposed, in the path of contamination. Either monitoring or modeling is needed to mount an effective response.
3. To what extent are plankton, bottom-dwelling biota, shoreline biota, surface dwellers exposed. Knowing this sets even better priorities on response and control.
4. What is the mode of action of the material? Acutely toxic, chronically toxic? Does it bioaccumulate? Biomagnify?
5. What type of response would do the most good and cause the least harm? Alternatives include: no action, collection and removal, in place treatment (chemicals, bioremediation) and/or dispersion and dilution.
3. PUGET SOUND BASIN POLLUTION QUESTIONS
o
What are the contaminants of concern ?
o Where are they/what are the
sources ?
o Is contamination getting better or worse?
o Are salmon
exposed ?
o Are salmon experiencing effects ?
o Are the
effects significant ?
o What actions will reduce the risk?
4. CONTAMINANTS OF CONCERN
There are dozens of biological, physical and chemical materials that could impact salmon
5. DEFINITION
6. OVERVIEW OF PUGET SOUND STUDIES
Many lines of investigation since the 1960's. Important outcomes: New
"discoveries" occur as a result of first time
monitoring/research (they may have been there years ago, maybe even worse;
Studies have been leading to National recognition; decisions have to be
made, meanwhile science goes on, exploding past myths, producing new
information, ideas, priorities.
1950's 1960's 1970's 1980's 1990's
Anecdotal xxxxxxxxxxxxxxxx x x x x x x x x x x x
Oyster Treatment xxxxxxxxxxxxx
Pulp Mill Pollution
xxxxxxxxxxxxxxxxxx
Outfall Monitoring xxxxxxxxxxxxxxx x x x x x
Water Quality Monitoring xxxxxxxxxxxxxx x x x x X
Bioaccumulation x x
x xxxxxxxxxxxx
Fish Diseases x x x x xxxxxxxx
Sediment
Contamination x x x xxxxxxx
Shellfish bacteria x x x xxxxxxx
Sediment Toxicity x x x xxx
"Mussel Watch" x x xxxxxxxx
"Superfund" Site Invest. xxxxxxx
Historical Sediment Cores
x x
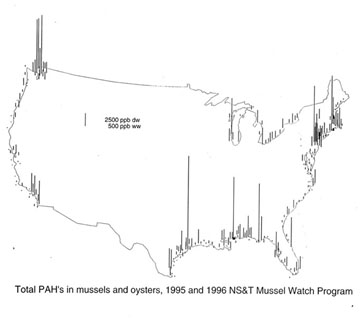
7. Puget Sound in national perspective: Map of PAH's in
US Mussels and Oysters
NOAA's National Status and
Trends Program uses shellfish to monitor contaminant trends at over 250
sites around the US. Puget Sound contains mussels with a wide range of
levels of PAH contamination, comparable to other larger major urban areas.
Dominant sources apprea to be combustion, spills, urban runoff. For other
contaminants, such as heavy metals, the Sound is relatively clean compared
to other urban coastal areas.
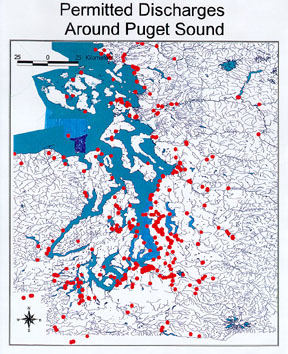
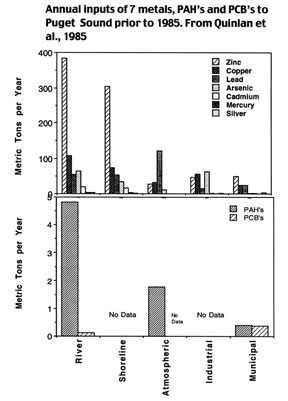
8. Sources of Contaminants:
Example -NPDES Sites.
The National Pollutant Discharge Elimination
System permits over 100 municipal and industrial discharges into waters of
the basin. They have to meet many criteria. Source: US EPA GIS data base
(see references)
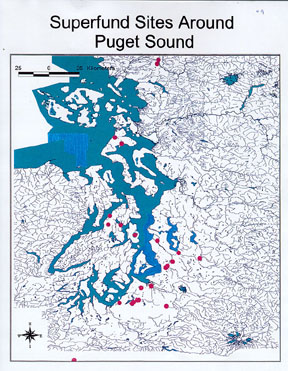
9. Sources of Contamination: Example
- Superfund Sites
Over a dozen sites, mainly in the southern half of
the basin and many are military and most are inland, away from the
shoreline (but possibly in the path of salmon). Source: US EPA GIS data
base (see references)
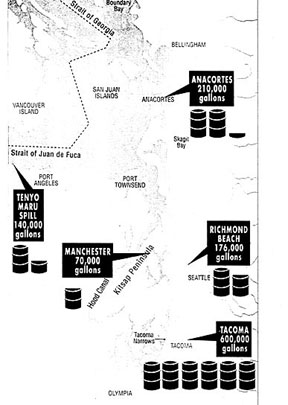
10. Sources of
Contaminants: Example - Map of Oil Spills, 1991-92
Map of amounts of
oil spilled during one year (1991-92); This was a particularly bad time
for spills in Puget Sound and adjacent waters. Commencement Bay topped
the list but others occurred in Seattle, Everett, Kitsap Peninsula and
offshore in the ocean. Source: Figure 2.4, page 20, State of the Sound
1992 Report, Puget Sound Water Quality Authority, Olympia.
STATUS OF EFFECTS ON FISH
Few studies have demonstrated large-scale effects of chemical contaminants on fishery populations. One of the few is by Prager and MacCall (1993). They found evidence that DDT may have contributed to the demise of the Pacific sardine in California ("Cannery Row" days). It has since recovered. Salmon present a different challenge.
11. What kinds
of effects should we look for in salmon?
Physiology, growth,
reproduction, disease, contamination, are all responses of fish to
pollutants.
12. Where should we look for effects
of contaminants on salmon?
The bigger the "X" the higher the
chance for exposure and effects. The places to look for effects of
pollutants on salmon are where the salmon go. Most critical may be the
vegetated urban shorelines and upstream.
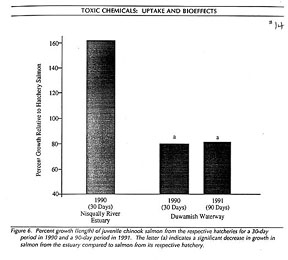
13. Slow growth of juvenile
salmon in the Duwamish Waterway.
Slower here than in less contaminated
Nisqually River tidal area. This and related impacts (immunosuppression,
enzyme alterations, etc) summarized in Casillas et al., 1995 (See 1995
Puget Sound Research Conference papers ).
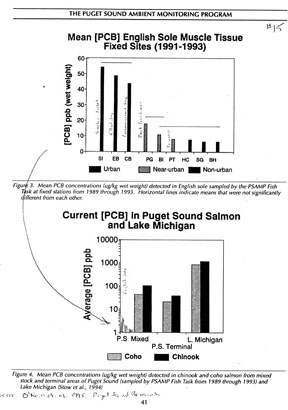
14. Tissue
contamination: PCB's in adult salmon.
Concentrations have been higher
than in resident species such as English sole. May be do to
biomagnification and their higher position on the food chain than English
sole, and/or to higher lipid content of salmon? Source: O'Neill et al.,
1995 (below).TRENDS
With notable exceptions
Puget Sound chemical contamination is decreasing and has been doing so for
several decades. I prepared the accompanying viewgraphs from data on
concentrations of contaminants in one of six dated cores taken in 1991 as
reported by Lefkovitz et al (1995 and 1997 and as summarized in Crecilius
et al., 1995; see references, below). "Core 3" was taken from a
point in the deep basin of Puget Sound located several miles due east of
downtown Seattle and within several miles of the West Point Outfall. It
was cut into 25 sections and each section dated using special
radiochemistry methods. The oldest date is about 1890 (with an error of
plus or minus 3-4 years).
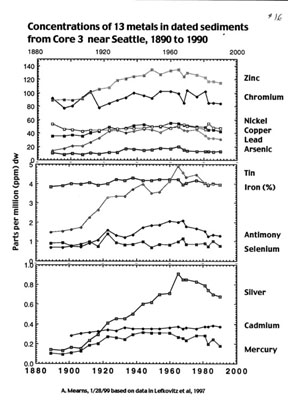
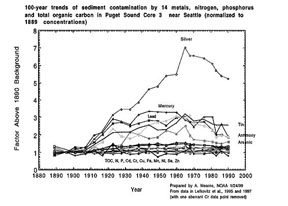
15. and 16. Metal Contamination
History
Metals are natural constituents of sediments. Contamination
by seven metals (silver, arsenic, copper, mercury, lead, antimony and
zinc) began around the turn of the century, reached a maximum in the
mid-1900's and have been decreasing since. Concentrations of copper,
lead, antimony and zinc declined significantly in the past 20 years. When
"normalized" 1890 concentrations, only five showed levels of
contamination more than twice background; all the others varied within the
natural range.
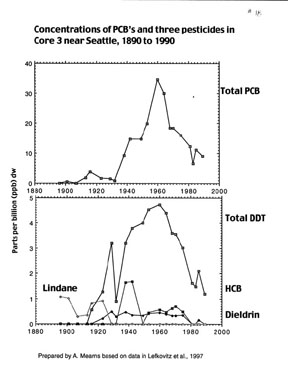
17. PCB's and Pesticides
Polychlorinated biphenyls (PCB's) are a group of
over 200 synthetic compounds, some mutagenic and carcinogenic (cancer
promoting). Although their used was banned in the 1970's they are
persistent and remain contaminants of concern. PCB contamination in the
bottom of Puget Sound peaked during the early 1960's and have declined
since; levels are about what they were at the onset of World War II.
DDT and other related persistent pesticides experienced a similar
rise and fall, with the peak period of contamination occurring before
1960. Levels are about what they were in the 1930's.
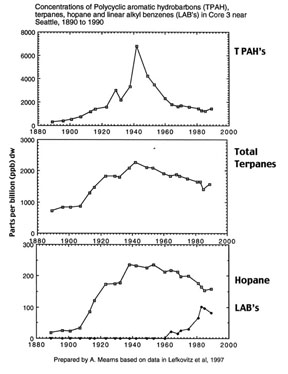
18. PAH's and Marker Chemicals
Polycyclic aromatic hydrocarbons
(PAH's) include over 40 chemical compounds many of which are toxic and
some of which are carcinogenic. They occur in coal, oil and fuel and
certain kinds increase greatly during combustion. PAH concentrations in
the Sound peaked during World War II and then decreased. Today levels are
about what they were in the 1920's. However, the sources may be different
(for example combustion runoff vs coal).
Terpenes, also natural chemicals, mark contamination from forest
industries. Again, concentrations peaked during 1940 to 1960 and have
slowly decreased since.
Hopane is a natural non-degradable chemical in oil and fuel and may mark the cumulative history of oil and fuel spills, again peaking in the 1940-60 era and declining slowly since.
LAB's - linear alkyl benzenes - are chemicals in modern laundry detergent. Thus, their recent rise indicates increasing detergent use.
19. Trends for nitrogen (N), phosphorus (P) and total
organic carbon (TOC)
Throughout the course of urban development of the
Basin there has surprisingly been no dramatic increase in N , P or TOC.
However, there is a "statistically significant" increase of a
few percent in recent decades, yet concentrations are far below what has
been observed elsewhere in eutrophic and sewage-polluted situations.
20. How Clean is Clean??
This plot of recent trends
in deep basin sediment copper offer some suggestions. Since 1960
concentrations have been decreasing from about 50 parts per million (ppm)
toward a natural background of 35 ppm. The lowest concentration (Effects
Range-Low, ER-L) in sediments that might elicit a toxic response (10% of
the time or less) is about 75. The level of more considerable concern
(Effects Range-Median, ER-M) is about 350 ppm. From this view, copper is
a non-problem and moving further away from one as well. With no further
action, it may approach "background" within the next decade.
Similar guidelines occur for many other chemicals and are being used to
set clean-up goals in more contaminated (inshore) sites.
21. How Effective Have We Been ?
Actions and legislation during the past 20 years probably helped, but
recovery was indeed started earlier.
22. Future: Report Outline
Challenge
Much more work is needed to asses the extent to which salmon
may be, or have been impacted by pollution. This outline represents
topics that need to be addressed.
References
Cassillas, E., M.A. Arkoosh, E. Clemons, T. Hom, D. Misitano, T.K. Collier, J.E. Stein and U. Varanasi. 1995. Chemical contaminant exposure and physiological effects in outmigrant juvenile chinook salmon from urban estuaries of Puget Sound. 657-677 In Volume 2, Puget Sound Research '95 Proceedings, Puget Sound Water Quality Authority, Olympia.
Crecilius, E.A., V.I. Cullinan, L.F. Lefkovitz and C. Peden. 1995. Historical trends in the accumulation of chemicals in Puget Sound. 825-831 In Volume 2, Puget Sound Research '95 Proceedings, Puget Sound Water Quality Authority, Olympia.
Dexter, R.N., D.E. Anderson, E.A. Quinlan, L.S. Goldstein, R.M. Strickland, S.P. Pavlou, J.R. Clayton, Jr., R.M. Kocan and M. Landolt. 1981. A Summary of Knowledge of Puget Sound related to Chemical Contaminants. NOAA Technical Memorandum OMPA-13. National Oceanic and Atmospheric Administration, Boulder, CO. 435 pp.
Edmondson, W.T. 1991. The Uses of
Ecology: Lake Washington and Beyond. University of Washington Press. 329
pp.
(Read Chapters 1-4).
Lefkovitz, L.F., V.I. Cullinan and
E.A. Crecilius. 1997. Historical Trends in the Accumulation of
Chemicals in Puget Sound. NOAA Technical Memorandum NOS ORCA 111.
National Oceanic and Atmospheric Administration, Silver Spring, MD.
Llanso, R.J., S. Aasen and K. Welch. 1998. Marine Sediment
Monitoring Program 1. Chemistry and Toxicity Testing, 1989 - 1995.
Publication No. 98-323. Washington State Department of Ecology,
Environmental Investigations and Laboratory Services Program, Olympia.
101 pp + Append.
O'Neill, S.M., J.E. West and S. Quinnell. 1995. Contaminant monitoring in fish: overview of the Puget Sound Ambient Monitoring Program Fish Task. 35-50 In Volume 1, Puget Sound Research '95 Proceedings, Puget Sound Water Quality Authority, Olympia.
Prager, M.D. and A.D. MacCall. 1993. Detection of contaminant and climate effects on spawning success of three pelagic fish stocks off Southern California: Northern anchovy Engraulis mordax, Pacific sardine Sardinops sagax, and chub mackerel Scomber japonicus. Fishery Bulletin (U.S.) 91: 310-327.
Puget Sound Water Quality Authority, Olympia, WA
o Annual Updates (including 1998)
o Puget Sound Research. Proceedings from Conferences (1988, 1991, 1995, 1998 (in prep)
US EPA GIS data base, Puget Sound Basin, from the Coastal Resources Coordination Divsion, Office of Response and Restoration, National Oceanic and Atmospheric Administration, Seattle.