|
Project 1 is due April 29th. I encourage you to hand it in early though if it will help you pace yourself for the exams
and project 2. Remember that projects 2 and 3 are a continuation of project 1. You will get feedback from Project 1 to help you
more successfully complete the other projects. Remember that you are an implementer for Project 1 which means your
responsibility is to be sure to implement the minimum requirements. You should add your own creative ideas on top of the
minimum requirements specified below. The relationship you have with me on project 1 is typical of the relationship a Web
site designer (you) would have with a client (me) as you designed a site to their spec.
Your responsibility is to design Web pages that will track, manage, and integrate environmental data from the Puget
Sound area such that three specific audiences are provided information they would want based on their interests. You
have the flexibility to determine your own organizational theme that would use data from one of the five areas of
interest below. For example, if you chose ocean circulation as your data theme, you could create a Sewage Management
organization (and name it something creative) for which you would design and implement Web pages. The data themes have been
suggested by me based on data I know is available to us from the PRISM project data stream. You will learn more about the
data stream as we prepare for integration with project 2. For now, just use the data types identified with your theme of choice.
You should always be thinking about the end users your Web pages are being created for. Some of your pages will be
most relevant to the scientists who are studying the data your organization is managing online. Some of your pages
will be relevant to a decision-maker who wants to consider laws and regulations based on the state of the environment
and potential anthropogenic (human action) effects of change. Your third audience member is the general public.
You should make pages for the general public as you would like to see them yourself.
Environmental Data Themes
Mesoscale Model 5 (MM5)
Distributed Hydrology Soil Vegetation Model (DHSVM)
Princeton Ocean Model (POM)
ABCPOM
Weather (Hourly) - Weather data is forecast on the UW campus using a popular weather simulation model called MM5. MM5 provides
temperature (degrees Kelvin), humidity (relative %), precipitation (millimeters), wind direction and intensity (vector meters/second), shortwave radiation (watts/meters-squared), and longwave radiation (watts/meters-squared. We'll have access to earth surface data, but the full model included layers heading up into the atmosphere.
Ocean Circulation (Hourly) - Ocean circulation data is forecast on the UW campus using a popular simulation model called
the Princeton Ocean Model (POM). POM provides ocean temperature (degrees Celcius), salinity (parts per thousand), current direction and intensity (vector meters/second), and vertical and horizontal viscosity for thirteen ocean layers at depth.
Soil State (Hourly) - Soil state data is forecast on the UW campus using a popular model called the Distributed Hydrology Soil
Vegetation Model (DHSVM). DHSVM soil provides soil temperature (degrees Celsius), soil moisture (relative %) at three levels (surface, roots, deep), snow water equivalent (meters-cubed),
water table depth (meters from bottom), and various long-term soil properties like porosity (relative percentage) or grain size (millimeters).
River Hydrology (Hourly) - River state data is forecast on the UW campus using a popular model called the Distributed Hydrology Soil
Vegetation Model (DHSVM). DHSVM provides river segment flow (cubic feet/second) and temperature (degrees Celsius) for thousands of locations on a stream network as well as segment volume (meters-cubed).
Marine Biology and Productivity (Hourly) - Marine biology and productivity data is forecast on the UW campus using an
extension of the POM model called ABCPOM. ABCPOM provides phytoplankton (mmo), zooplankton (mmo), phosphate (mmo), ammonium (mmo), oxygen (mmo), nitrate (mmo), and light densities (photons/second*meters-cubed) for twenty-nine layers at depth.
For project 1, you should add additional data you would want your organization to manage and report to make your organization
seem more useful and complete. You will be able to make up data for those data items when the PRISM models do not provide it
for you.
Each student in class will create their own Environmental Data Investigation System for the Web. I expect six Web pages from you to successfully complete project 1:
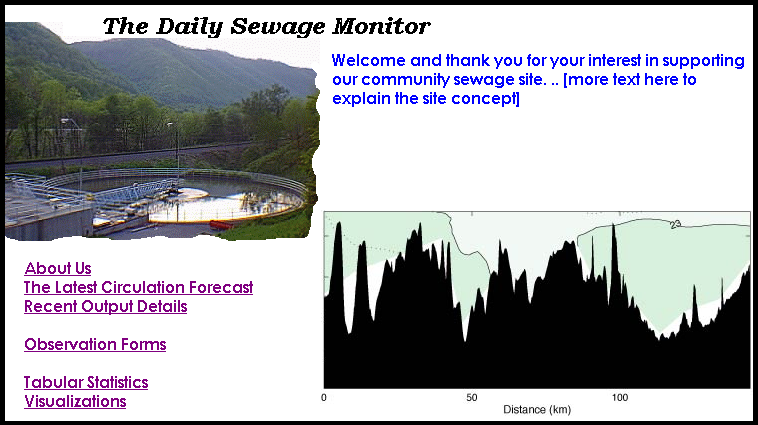
- An Organizational Home Page for your hypothetical organization with an attractive presentation that includes
hyperlinks to a form for entering actual data for an hourly timestep, a report that reviews the latest
forecast run results, a report that shows activity for the last 24 timesteps (hours), a report that identifies
the low, high, and average value for each variable your organization tracks, and a graphical visualizations page.
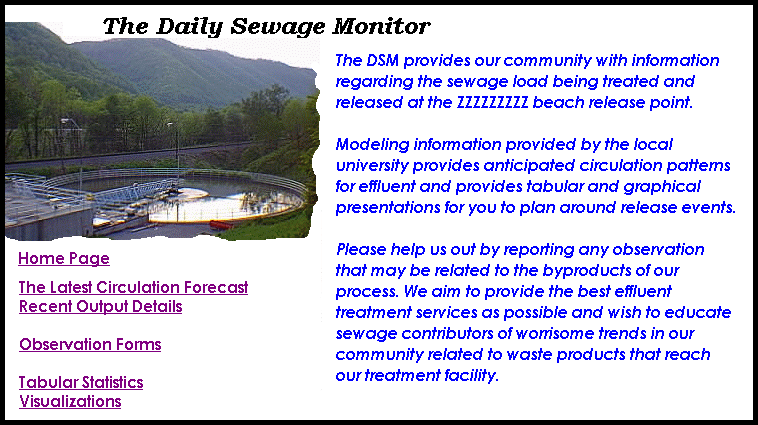
- An Organizational Details page that clearly explains what your organization does to the general public. You can call
this page About Us if you prefer that popular title.
- A Latest Forecast Page for your organization (with links to other pages you think the organization would want to access from there)
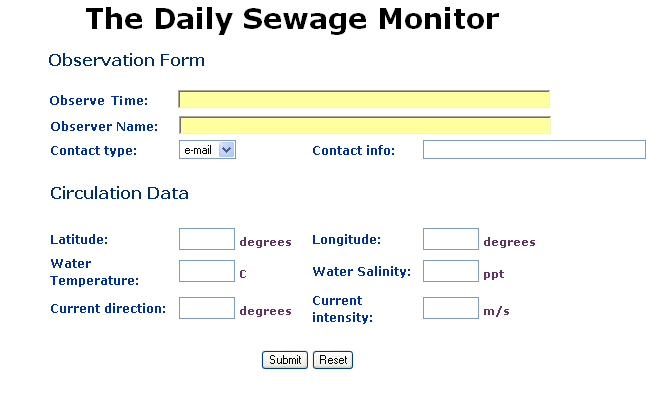
- A Latest Observed Form which a scientist would use to update your organizational database.
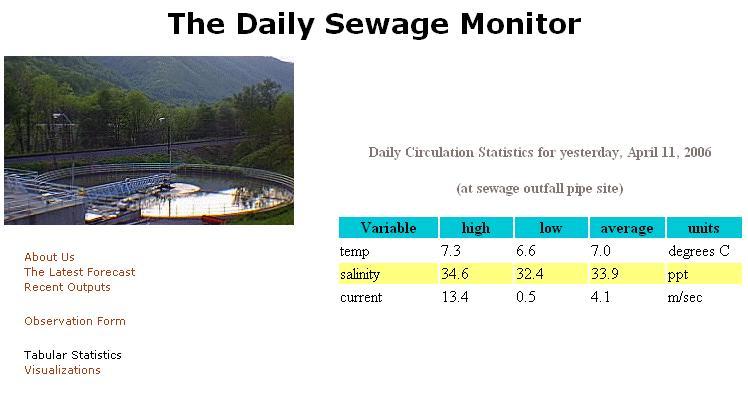
- A Statistics Page which presents at least the low, high, and average values for each variable over the last
24 hours.
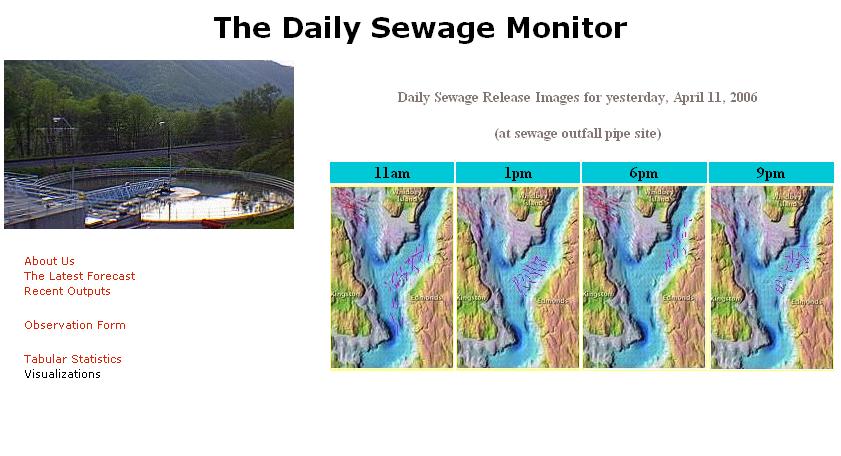
- A Graphical Visualizations page which will show your organization's data graphically (you can create images for the
content for now or download relevant looking examples from the Web).
Details:
The Organization Home Page page should look attractive, be easy to understand for all audience members, and have an appropriate flow to it.
Here are some examples from real Environmental Data home pages:
For an extensive portal approach, look at this GEO Data Portal.
For a graphical home page with links, look at Lower Colorado River Authority
For a more text-based home page, look at OCCAM Home Page
Please send me your favorite examples from surfing the Web so I can share them in class.
|