Copyright © Center for Environmental Visualization| ALL RIGHTS RESERVED.
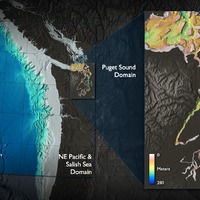
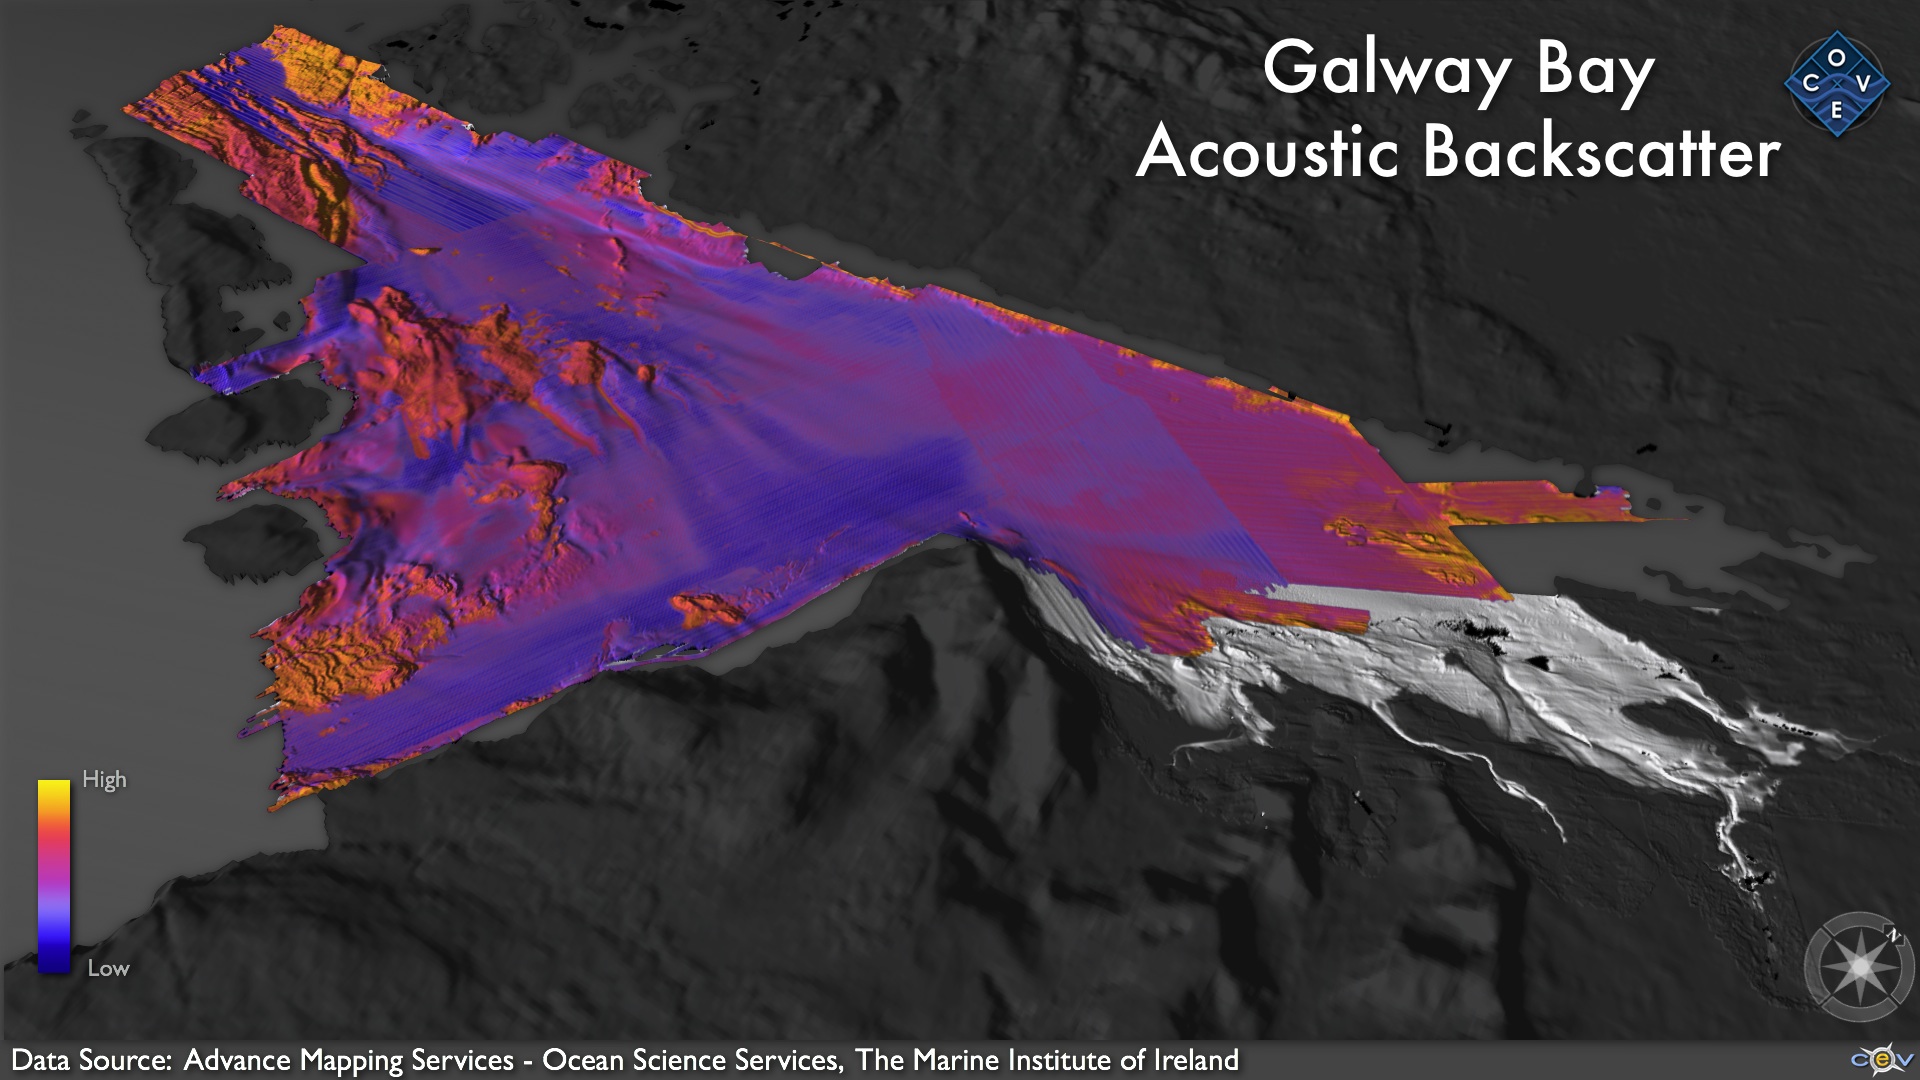
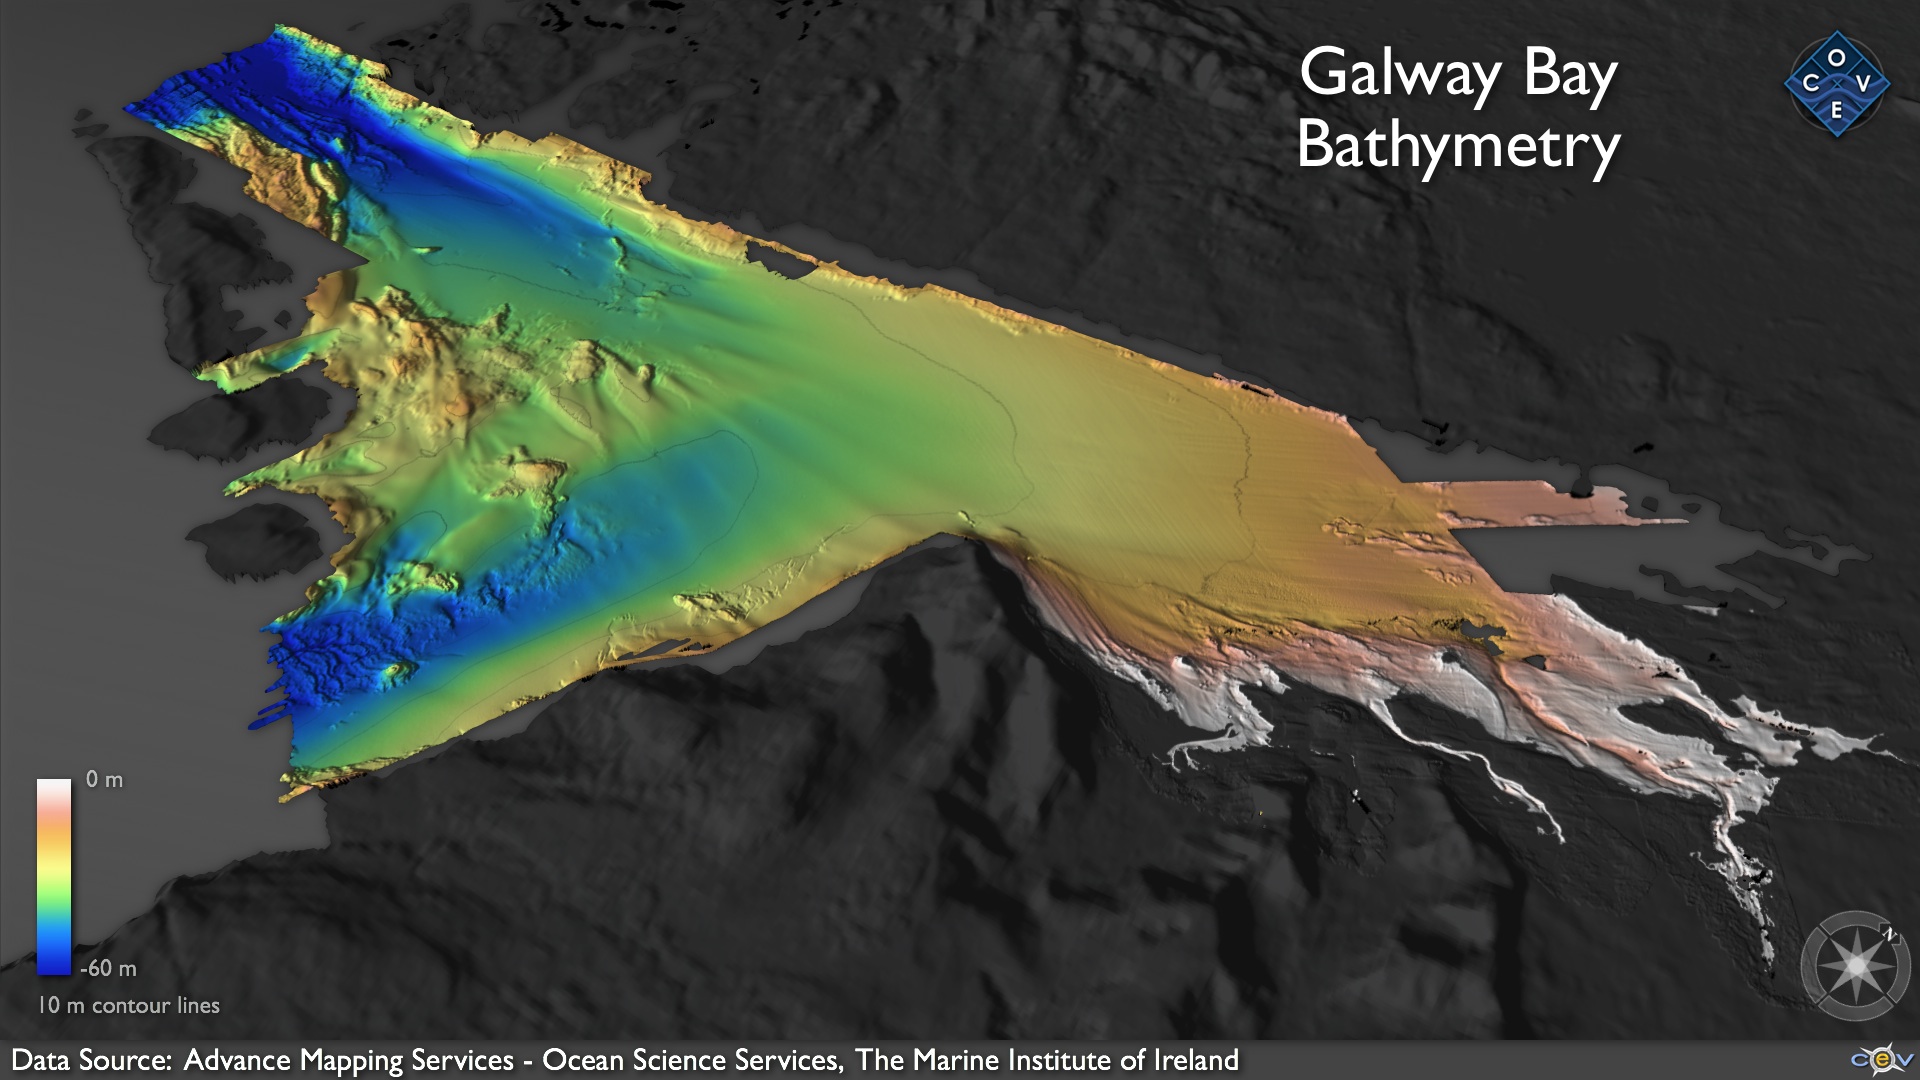
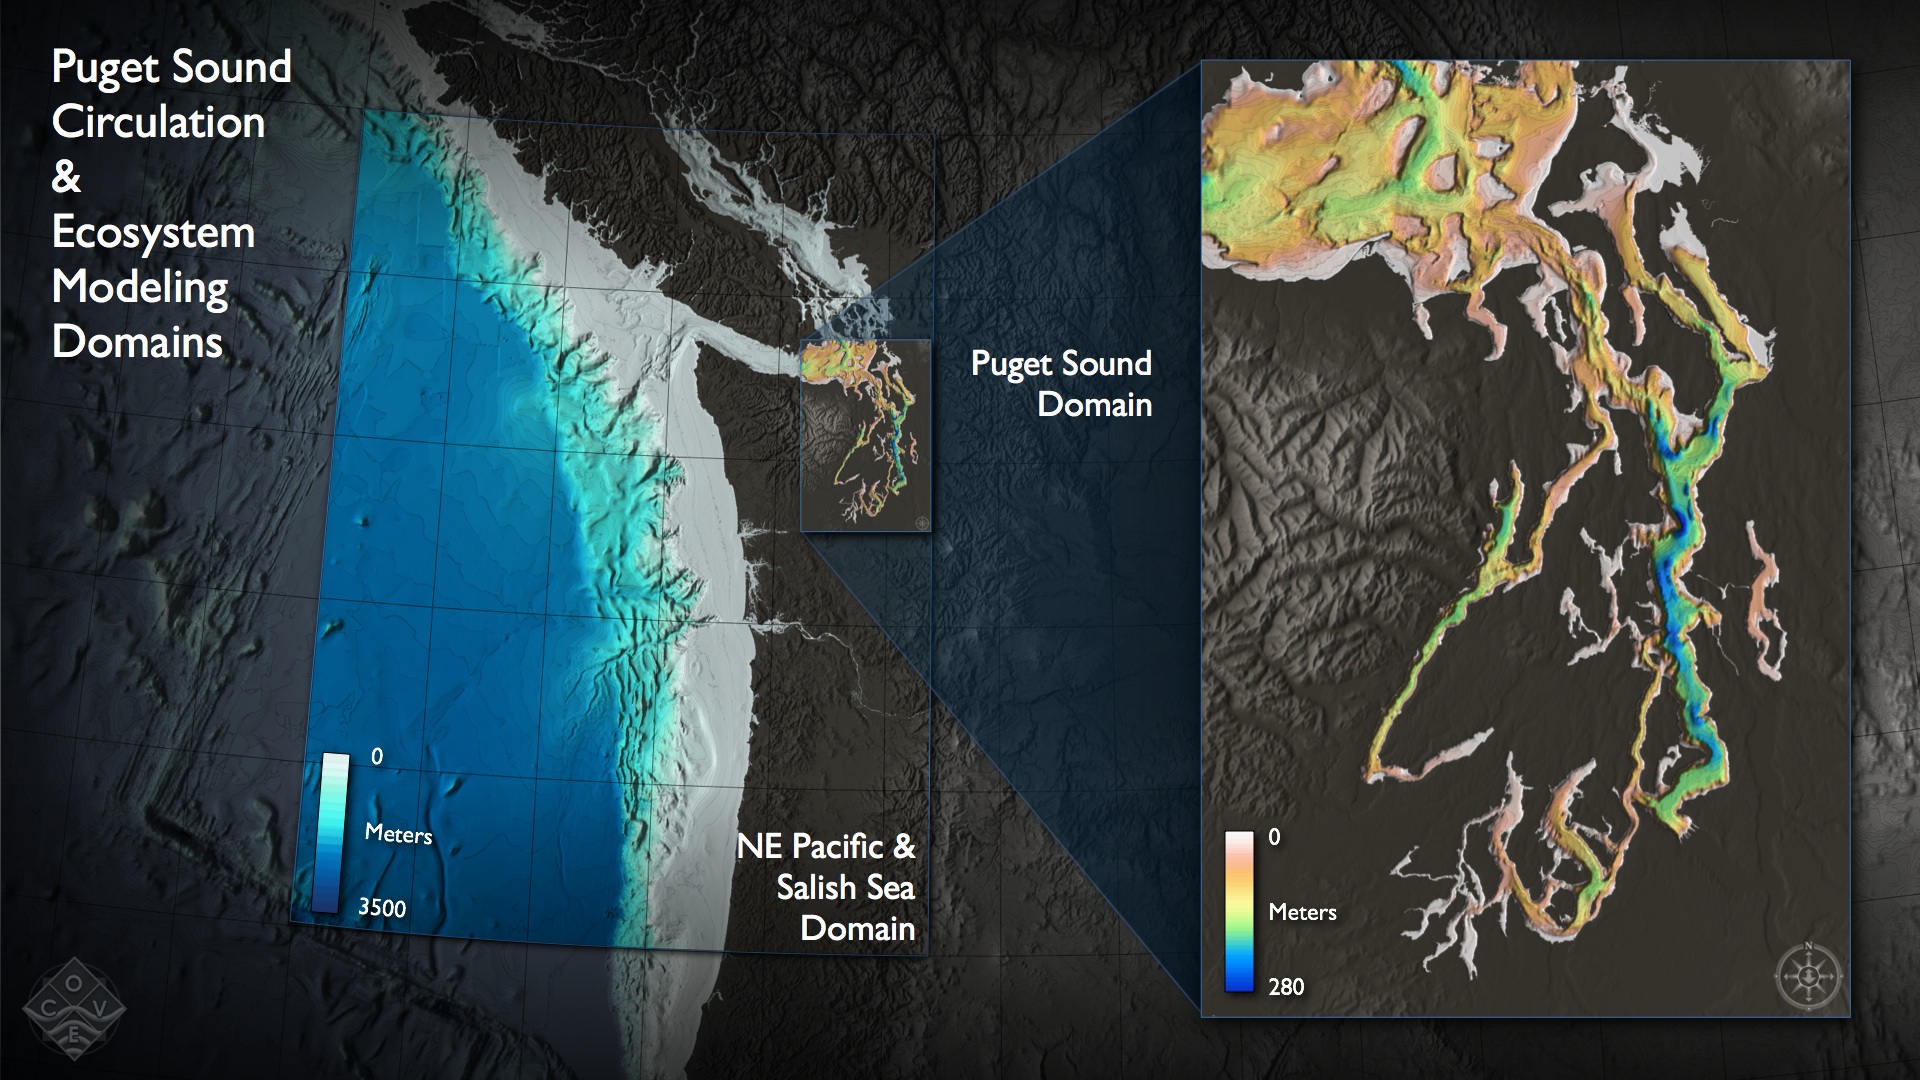
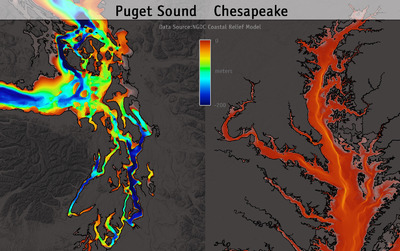
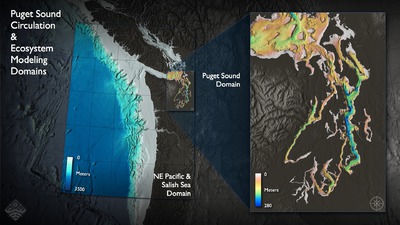
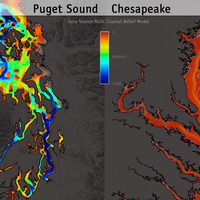
CEV using IRIS Explorer and more recently, the Collaborative Ocean Visualization Environment (COVE) has developed a number of visualizations of bathymetry and the ocean. Typical representations use color to represent depth, however, other parameters such as acoustic backscatter also can be represented.
Note, COVE also can overlay any image or texture on top of topography, similar to Google Earth. Geo-referenced images are the basis of a number of CEV visualizations.
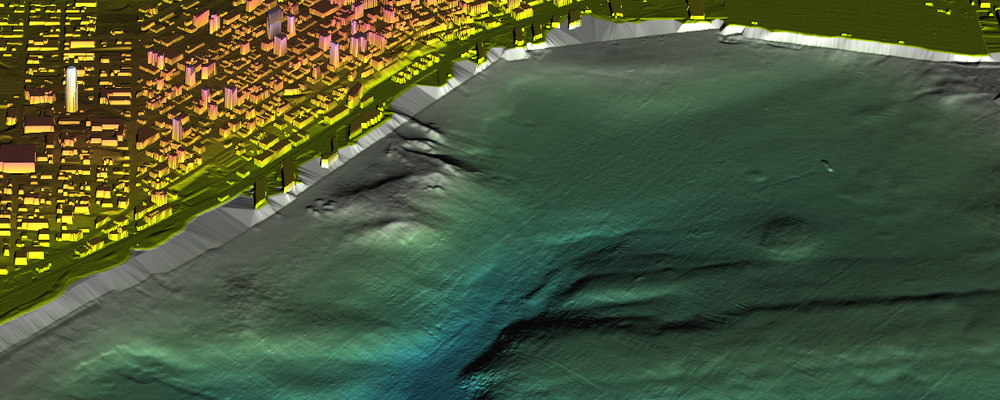
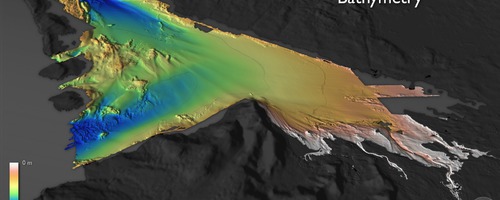
Elevation of downtown Seattle and bathymetry of Elliot Bay Data provided by David Finlayson (now with USGS) Link
×
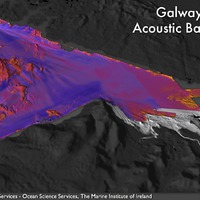

Acoustic backscatter visualization made with COVE. Data Source: Advance Mapping Services - Ocean Science Services, The Marine Institute of Ireland Link
×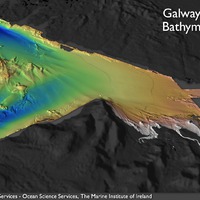

Bathymetry visualization made with COVE. Data Source: Advance Mapping Services - Ocean Science Services, The Marine Institute of Ireland Link
×