


Copyright © Center for Environmental Visualization| ALL RIGHTS RESERVED.


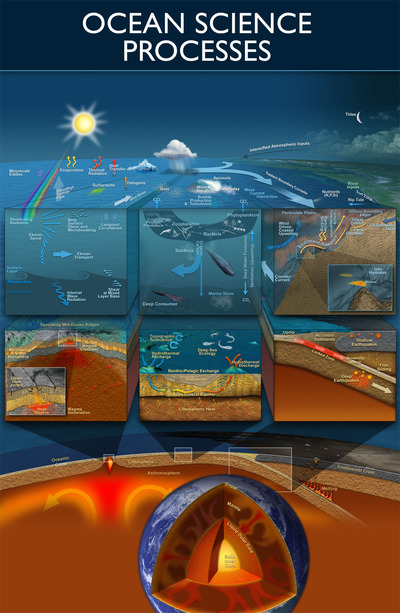
Scientific Illustration is art in service of science. Working with scientists, CEV employs technical and aesthetic skills to accurately portray earth and ocean processes. With the use of 3D perspective, cutaways, and exploded diagrams, CEV can represent structure and detail that allows the viewer to visually discover the inner workings of a given environment.
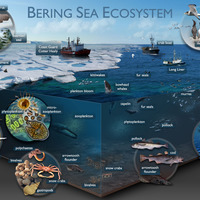
From complex food webs to detailed ocean observing systems, CEV’s illustrations provide clear, artistic and powerful representations for communicating both science and engineering.
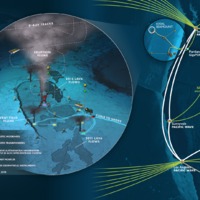

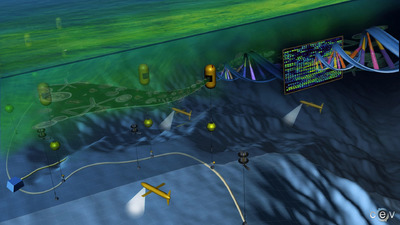
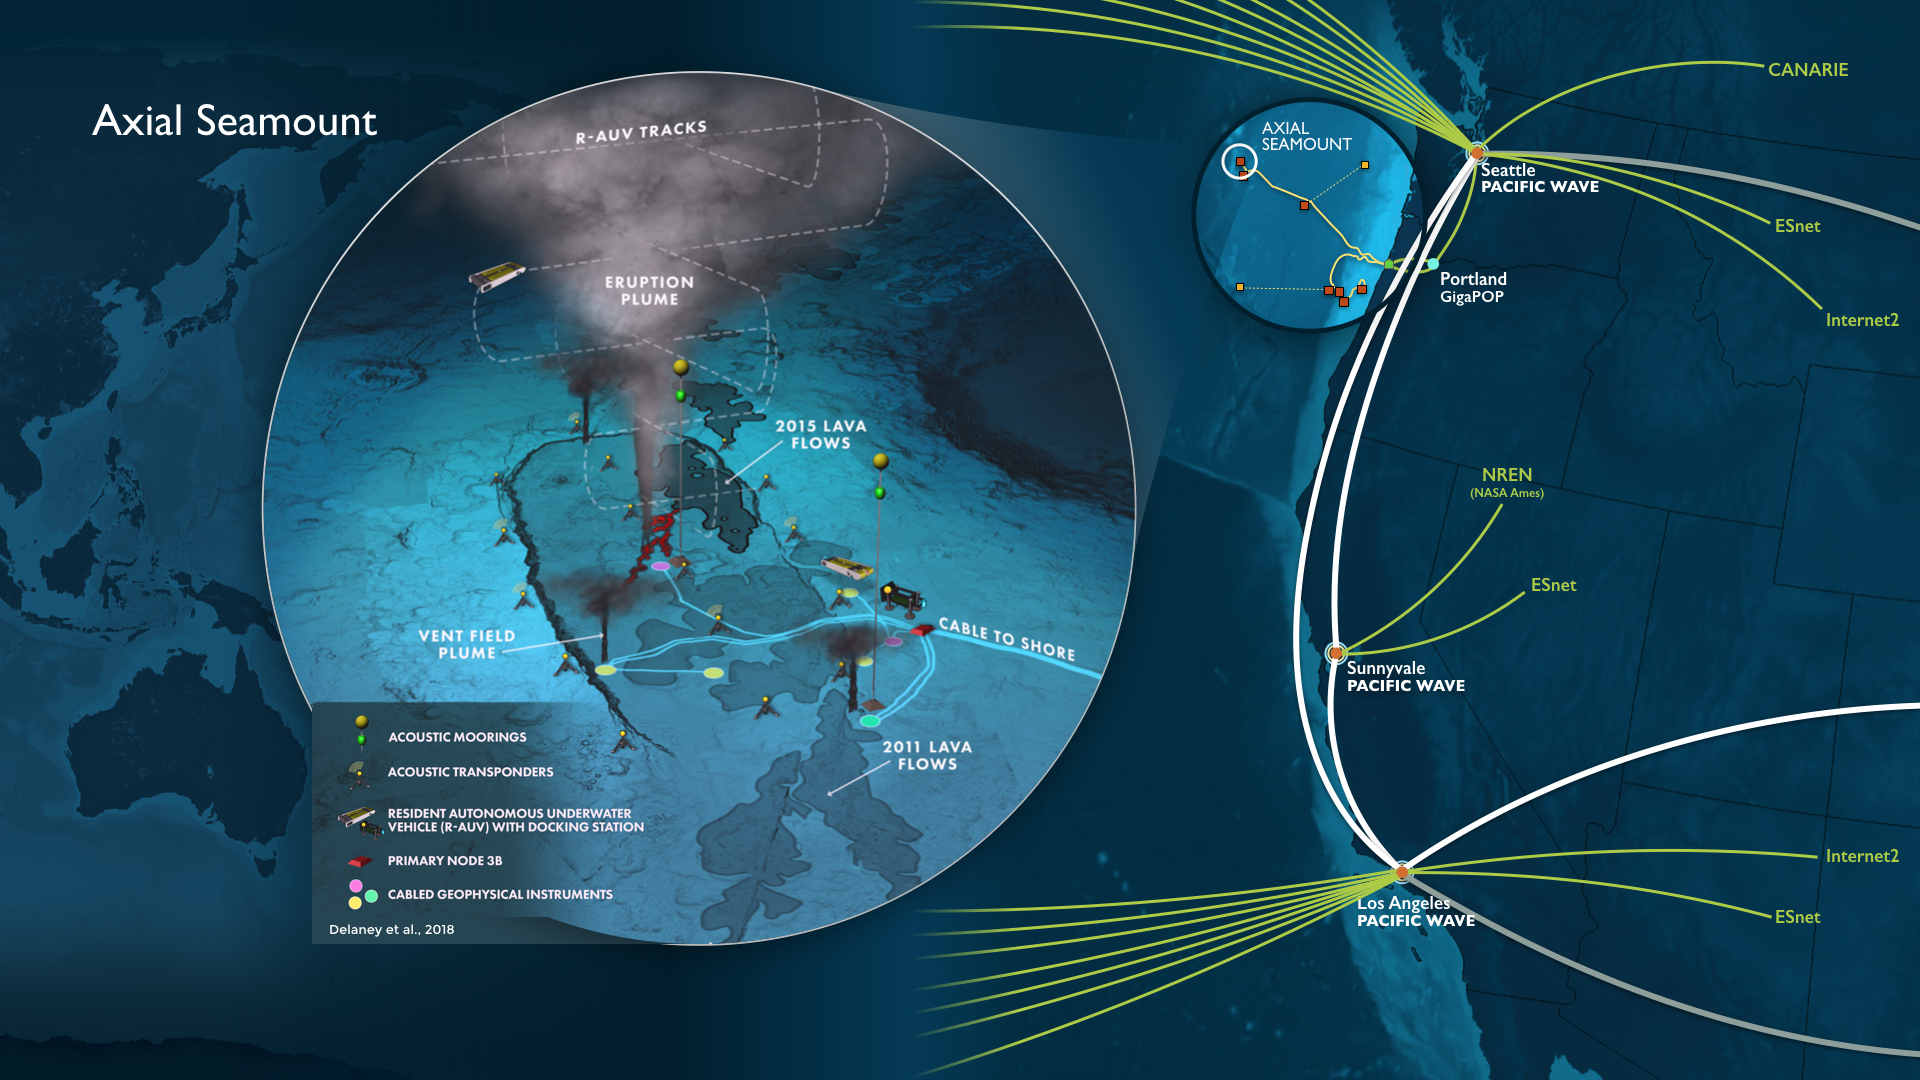
An illustration depicting CENIC's Pacific Wave network plus the Regional Cabled Array showcasing an eruprtion at Axial Seamount. Link
×
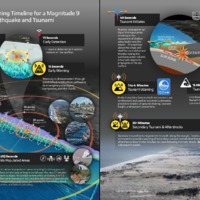
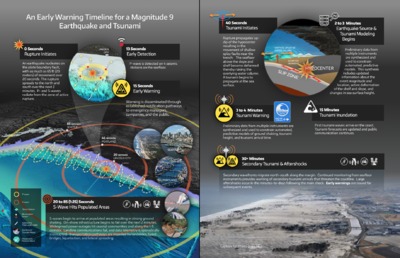
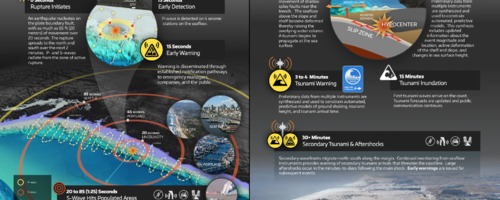
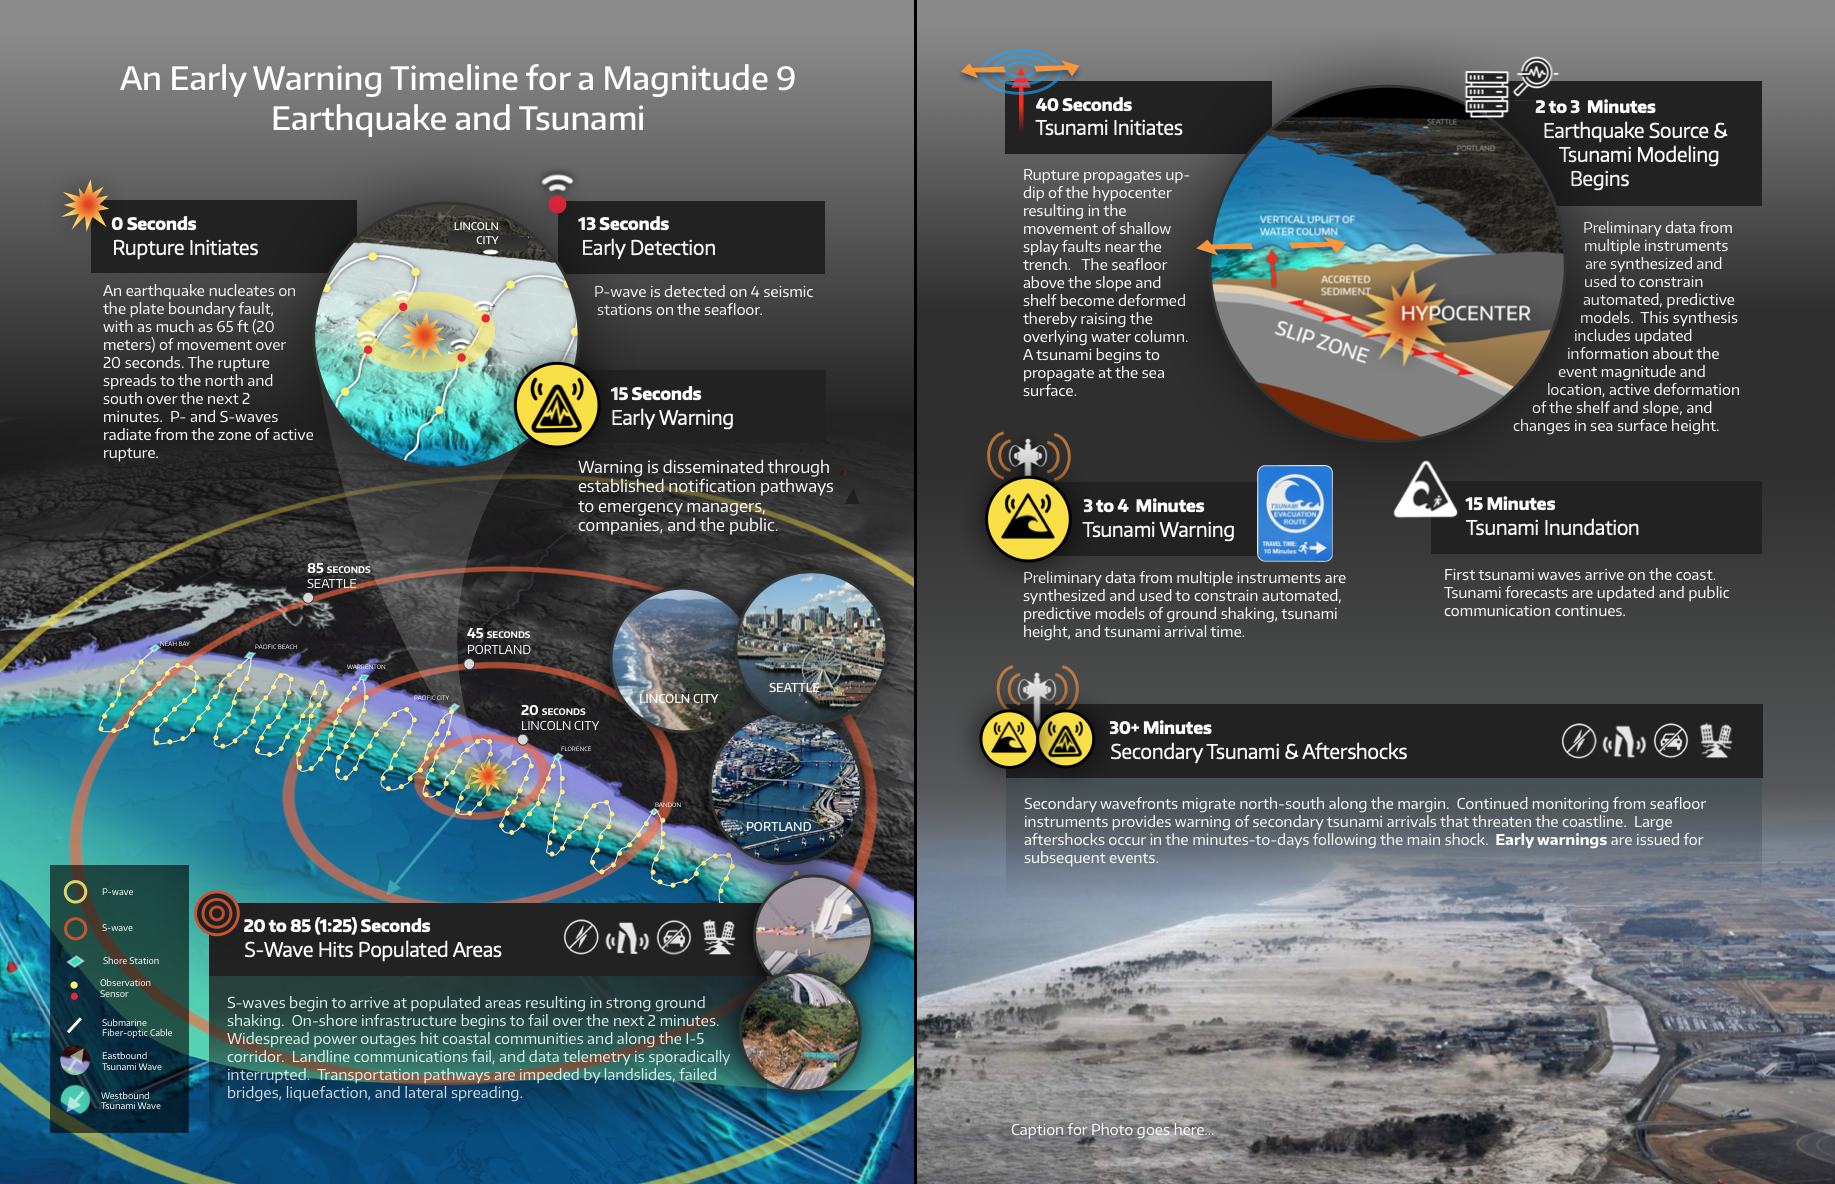
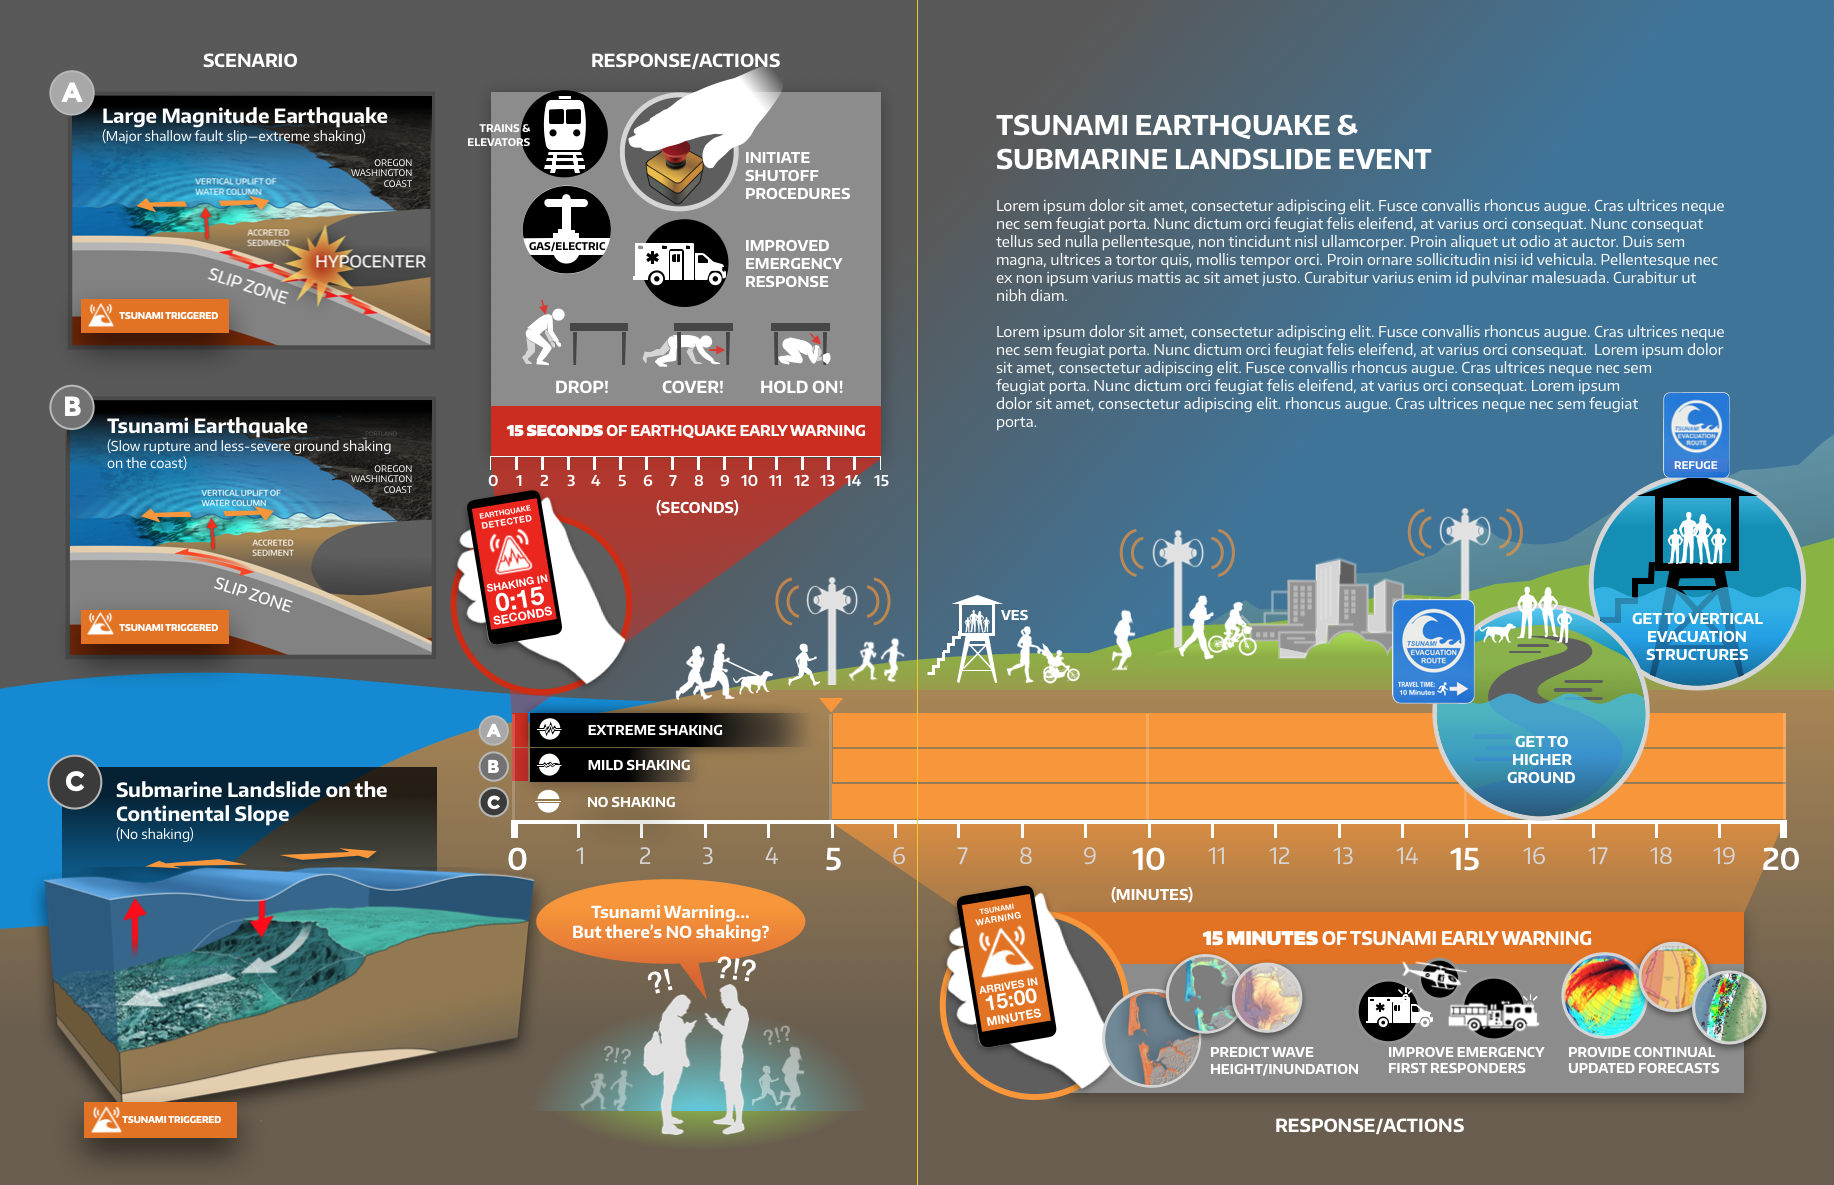
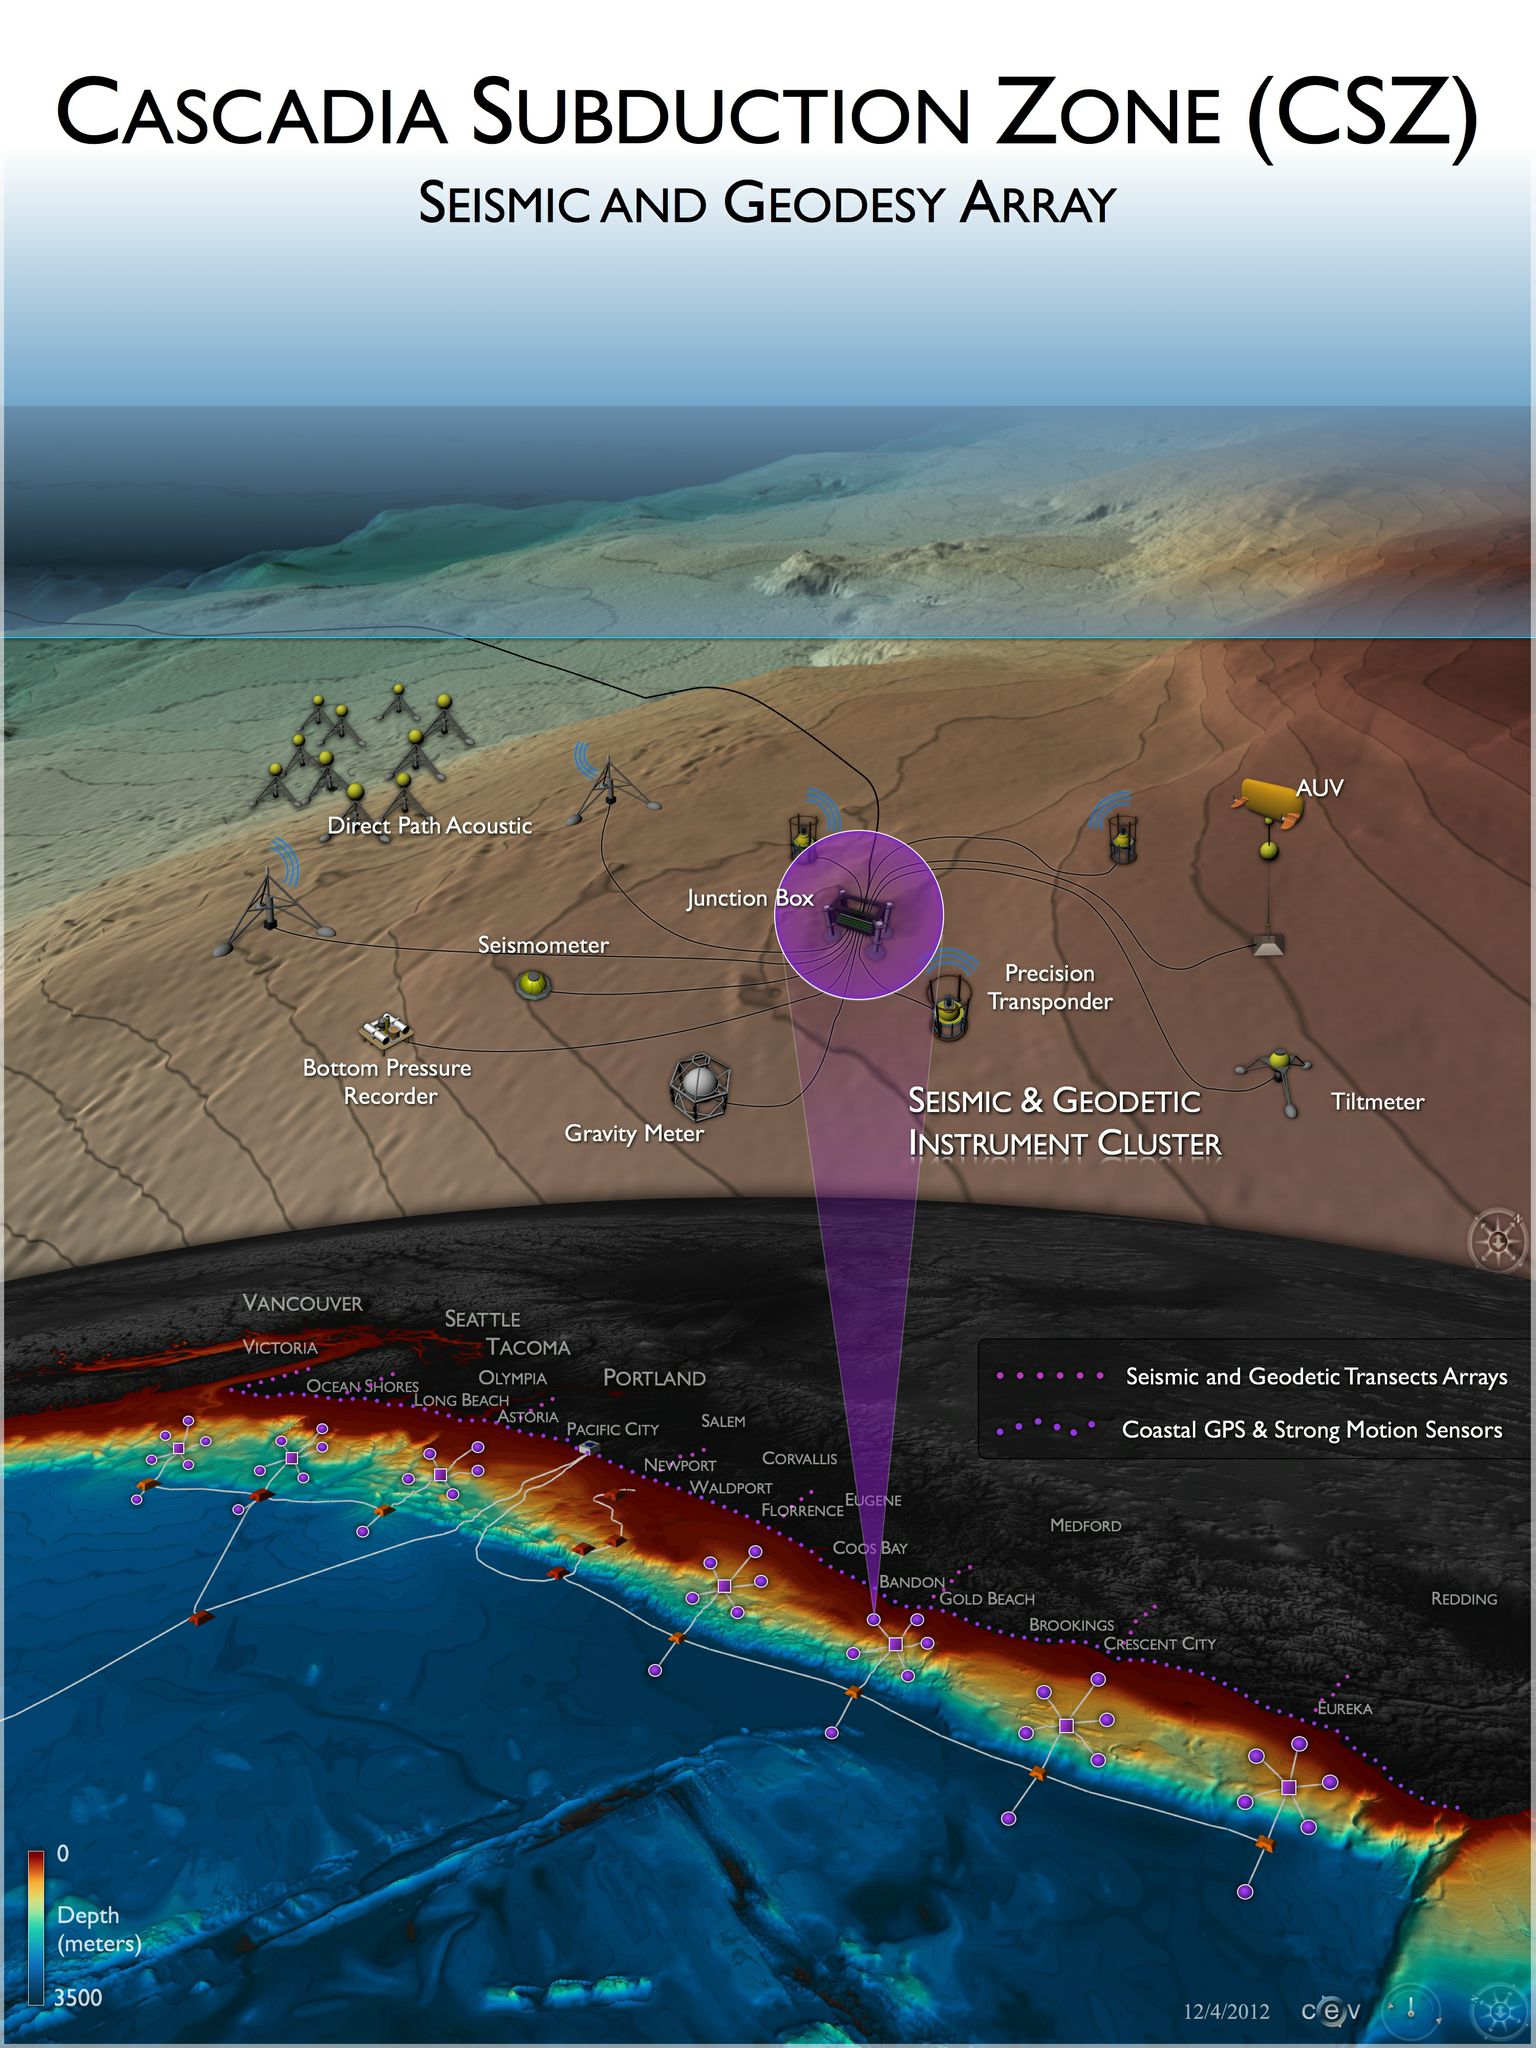
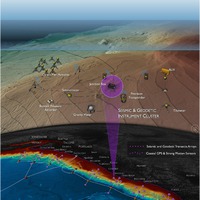
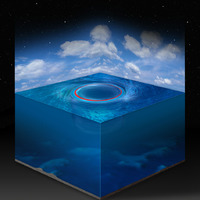
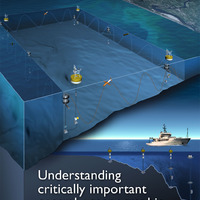
The scenario illustrated here uses a hypothetical source hypocenter (the initiation point of the earthquake rupture) approximately 40 miles off Link
×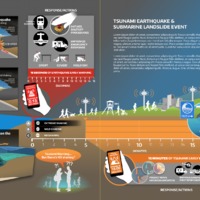

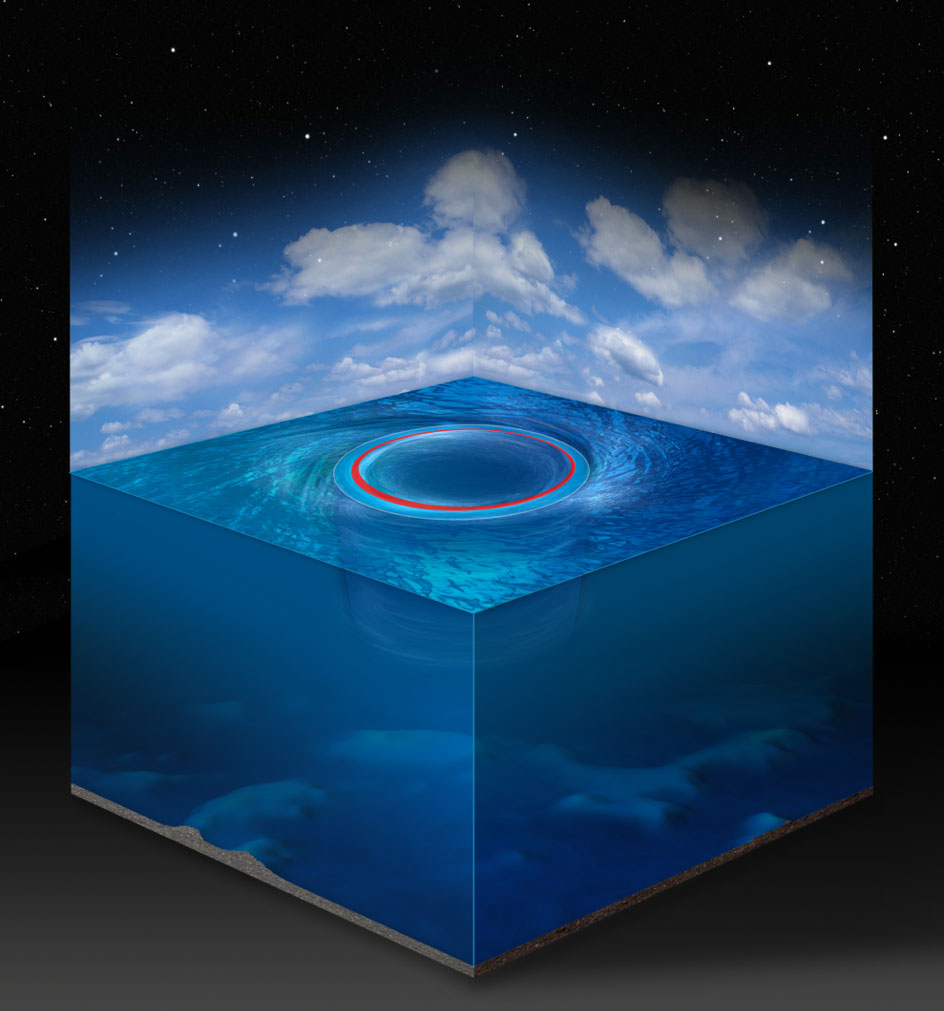
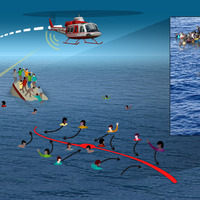
Here, displacement of material along the seafloor creates a large tsunami wave without any ground shaking felt at the coastline. These sce Link
×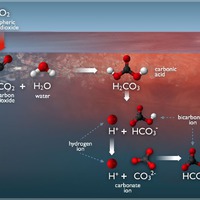
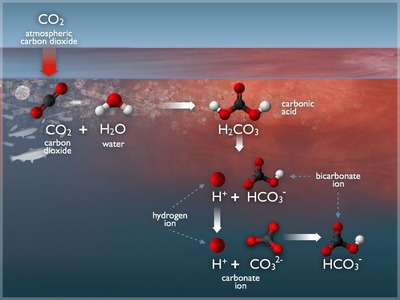
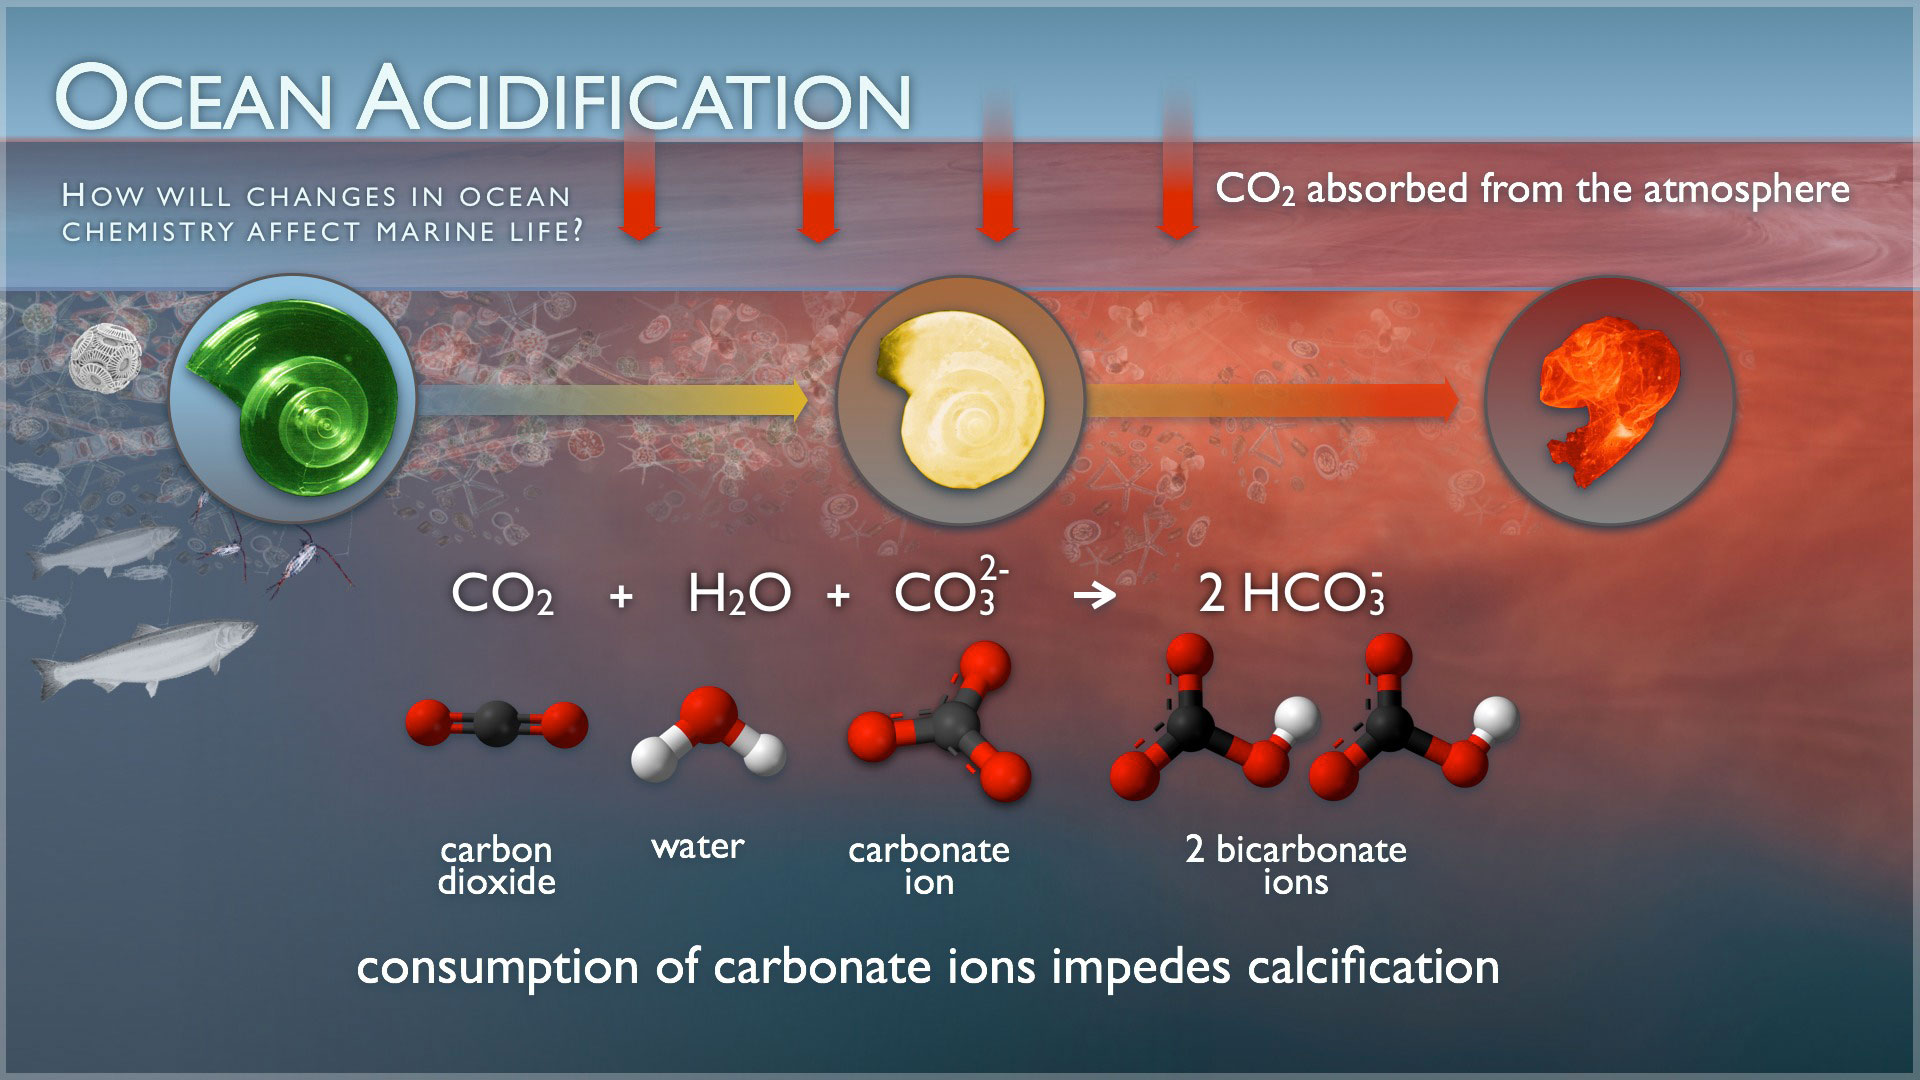
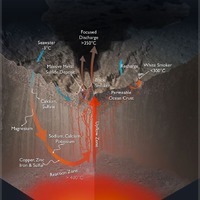
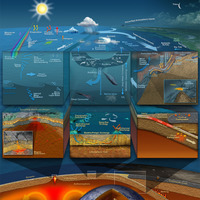
A scientific illustration depicting the chemistry of ocean acidification. Created for Pacific Marine Environmental Laboratory’s Carbon Prog Link
×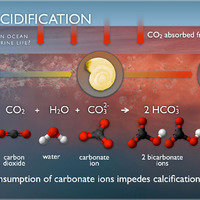

A scientific illustration of ocean acidification depicting the consumption of carbonate ions and how that impedes calcification. Created for Paci Link
×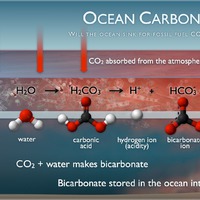
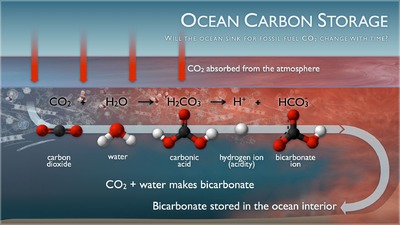
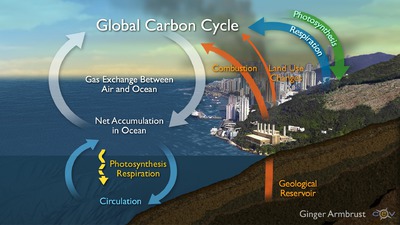
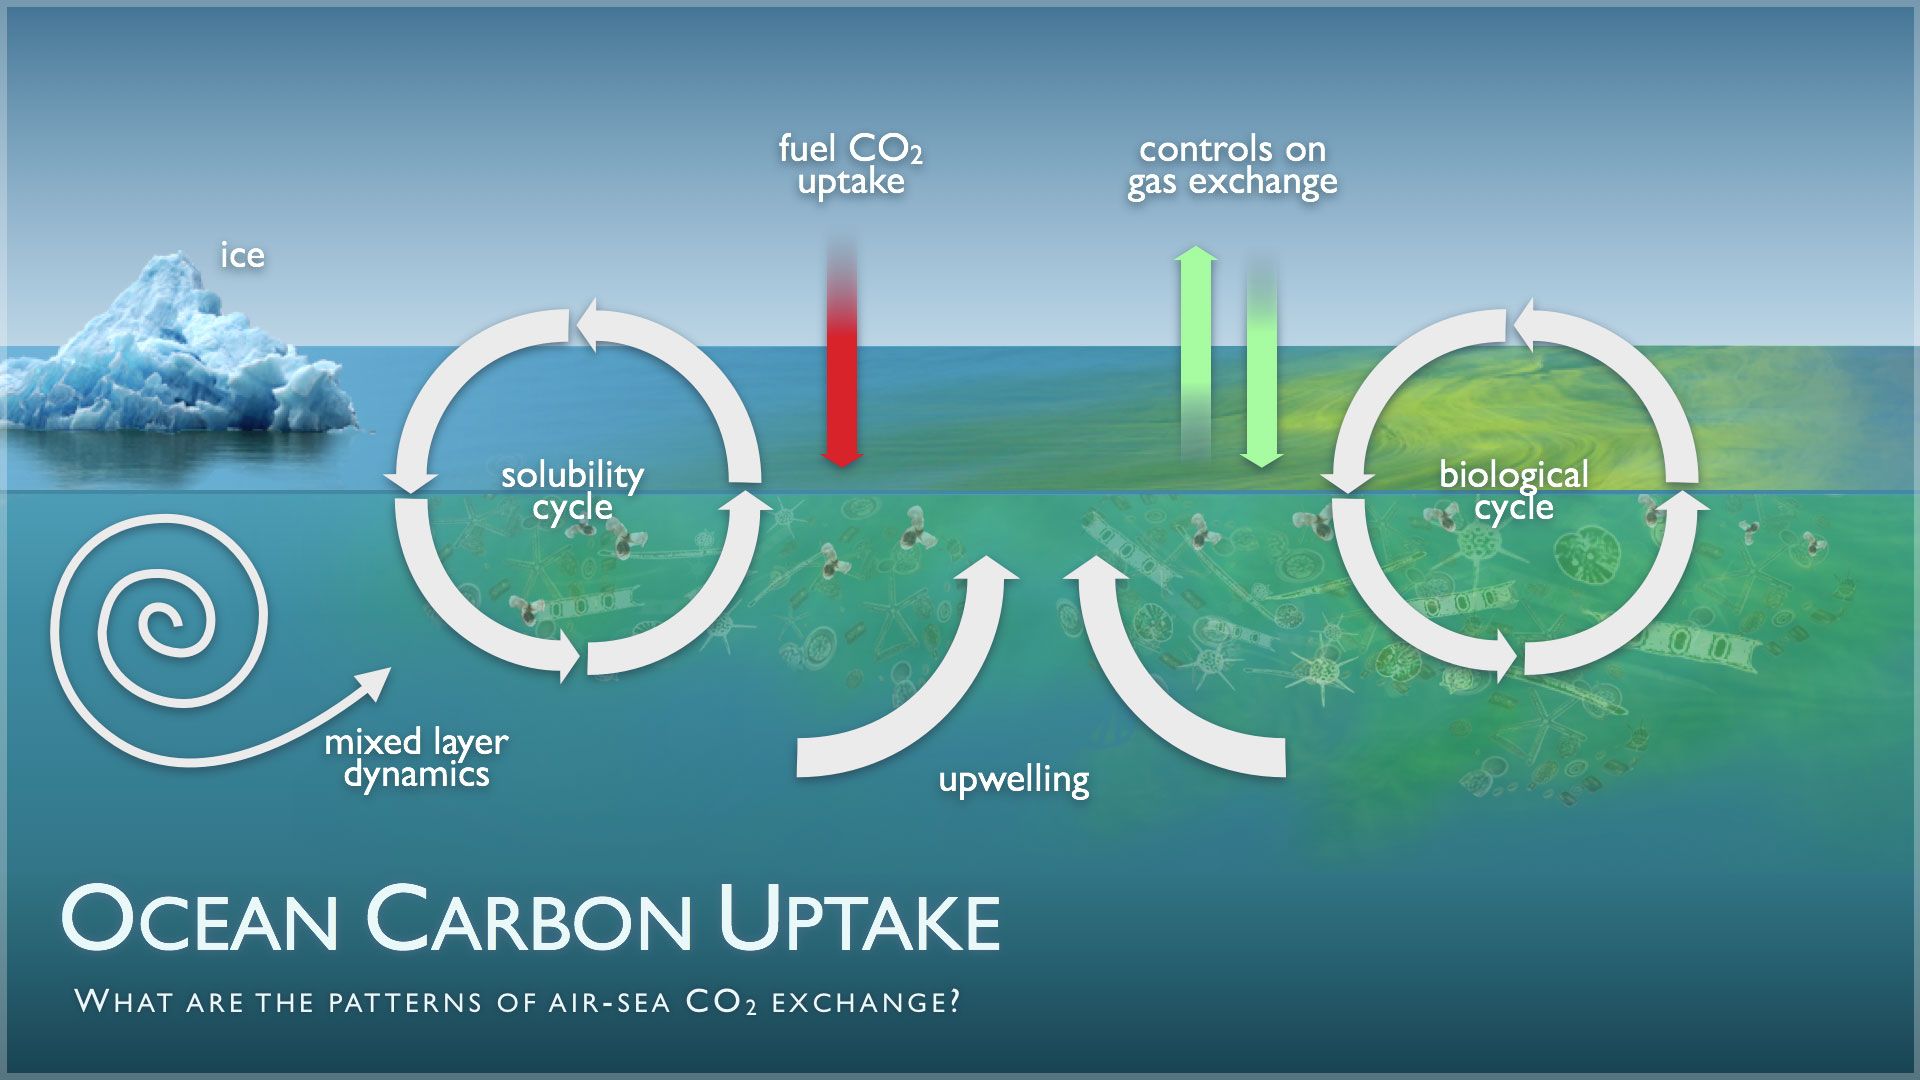
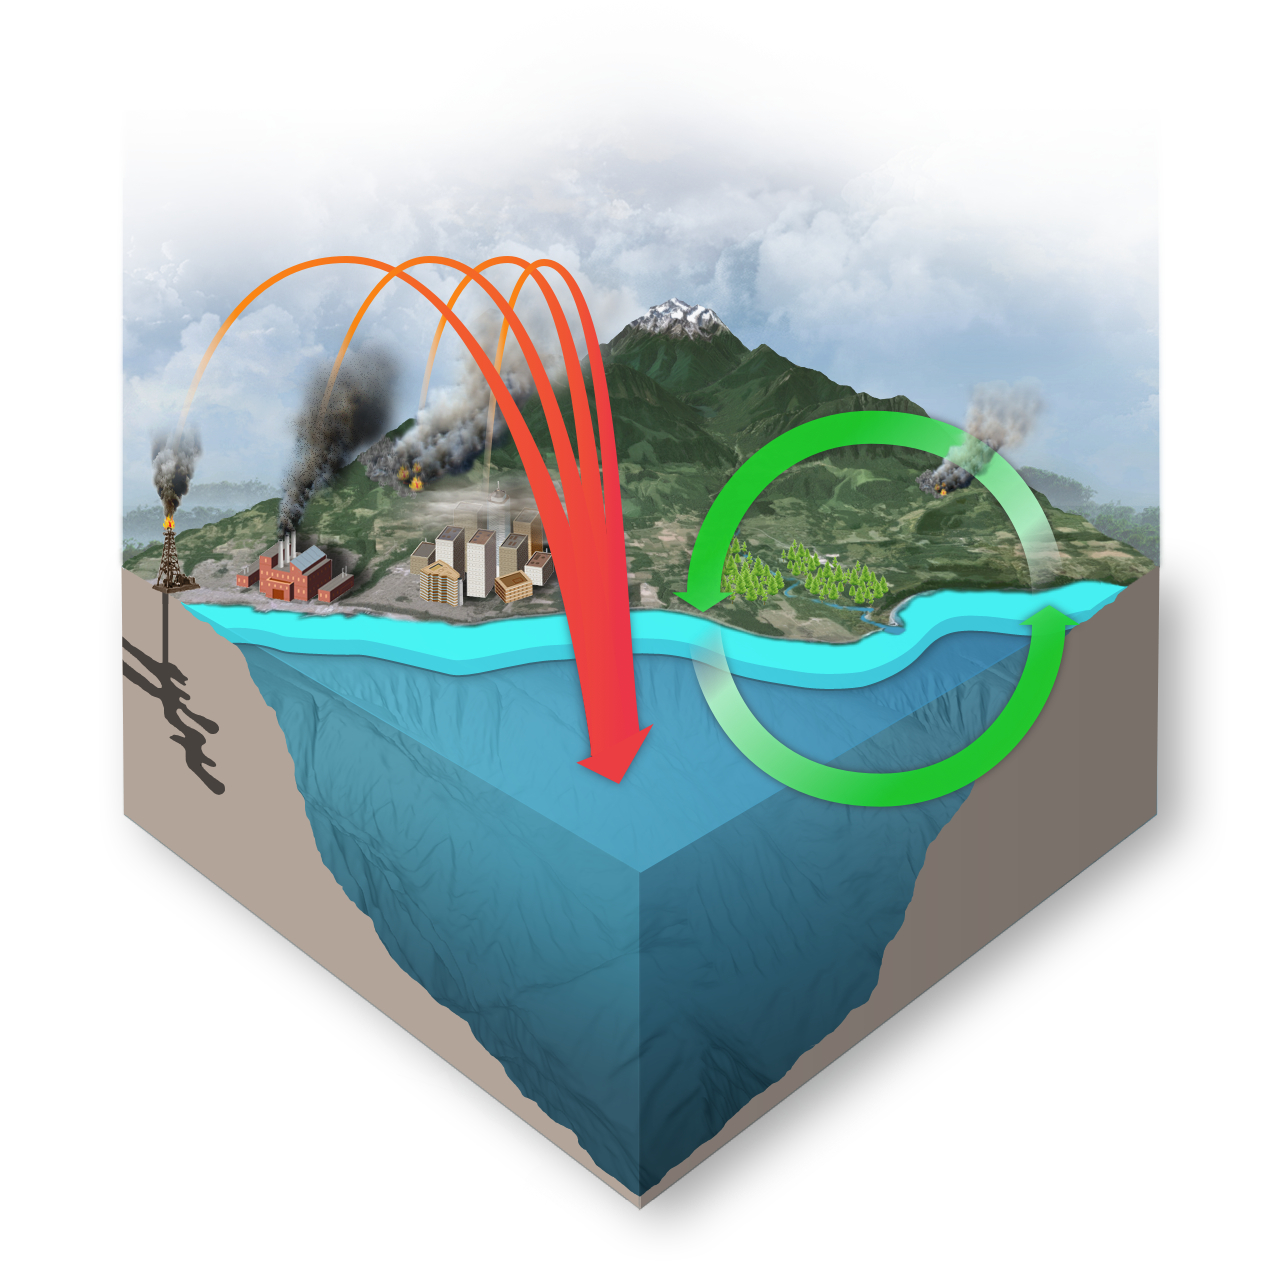
A scientific illustration of the process ocean carbon storage. Showing from when carbon dioxide is absorbed to when the carbon is stored as bicar Link
×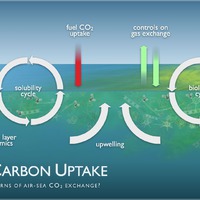

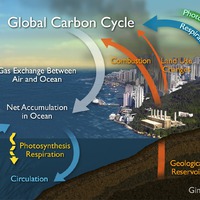
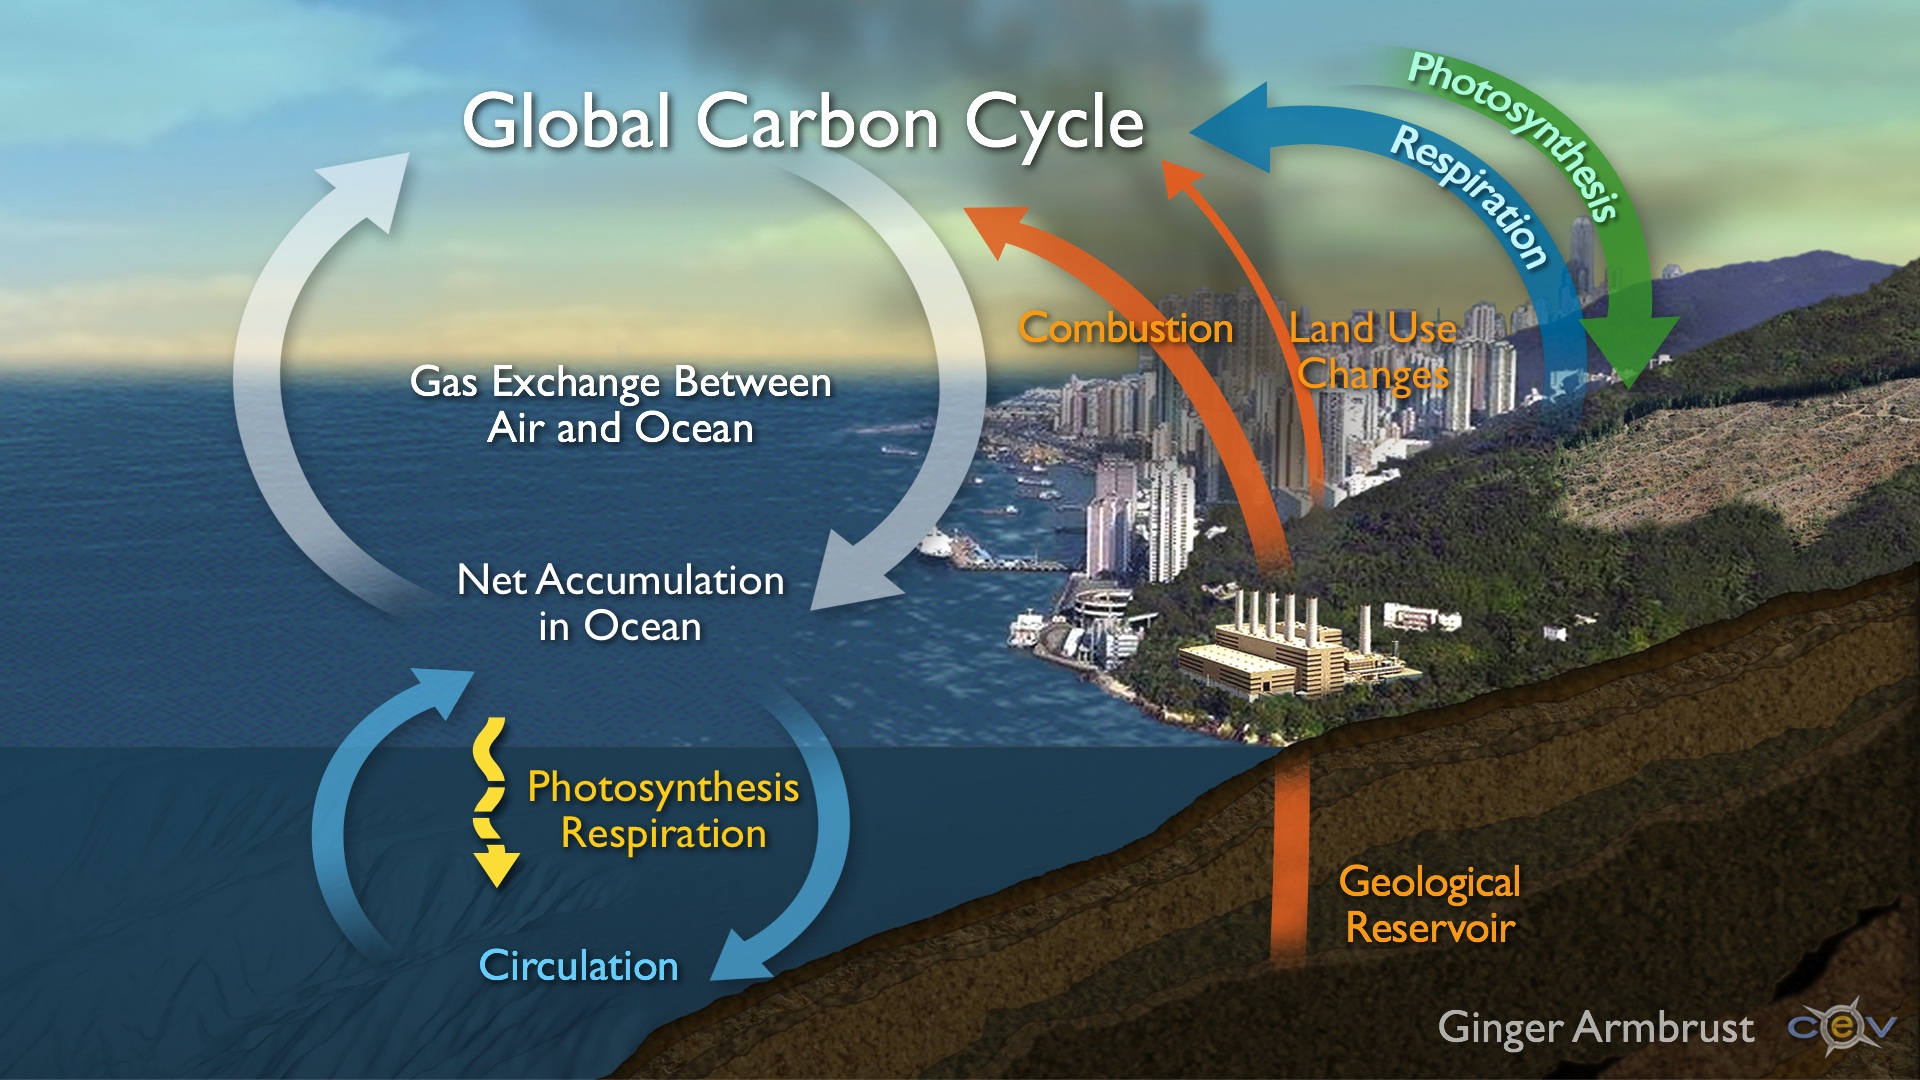
A scientific illustration depicting ocean carbon uptake and the many factors that play a role in the process of air-sea CO2 exchange. Created for Link
×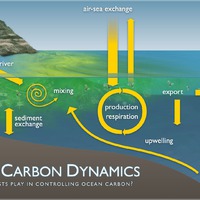
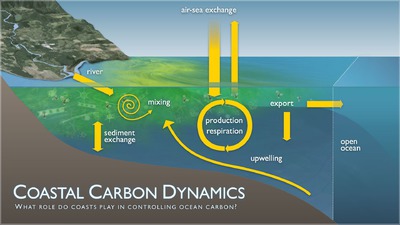
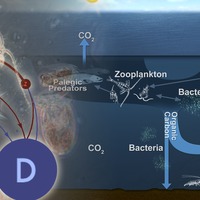
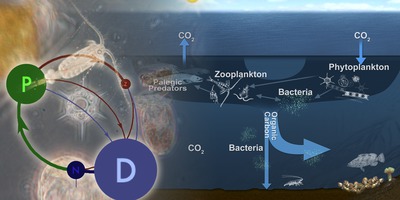
A scientific illustration depicting the complex cycles of coastal carbon dynamics. Created for Pacific Marine Environmental Laboratory’s Ca Link
×


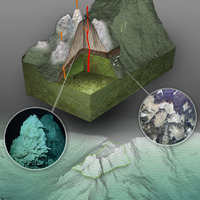

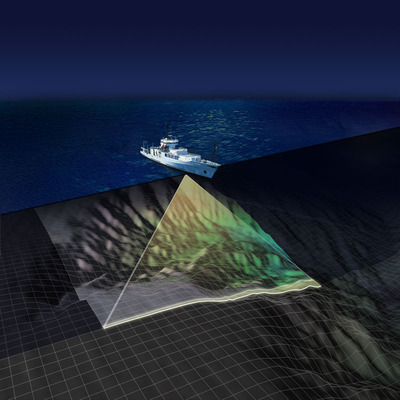
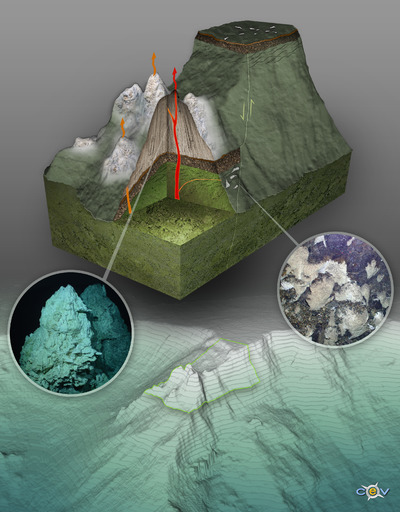
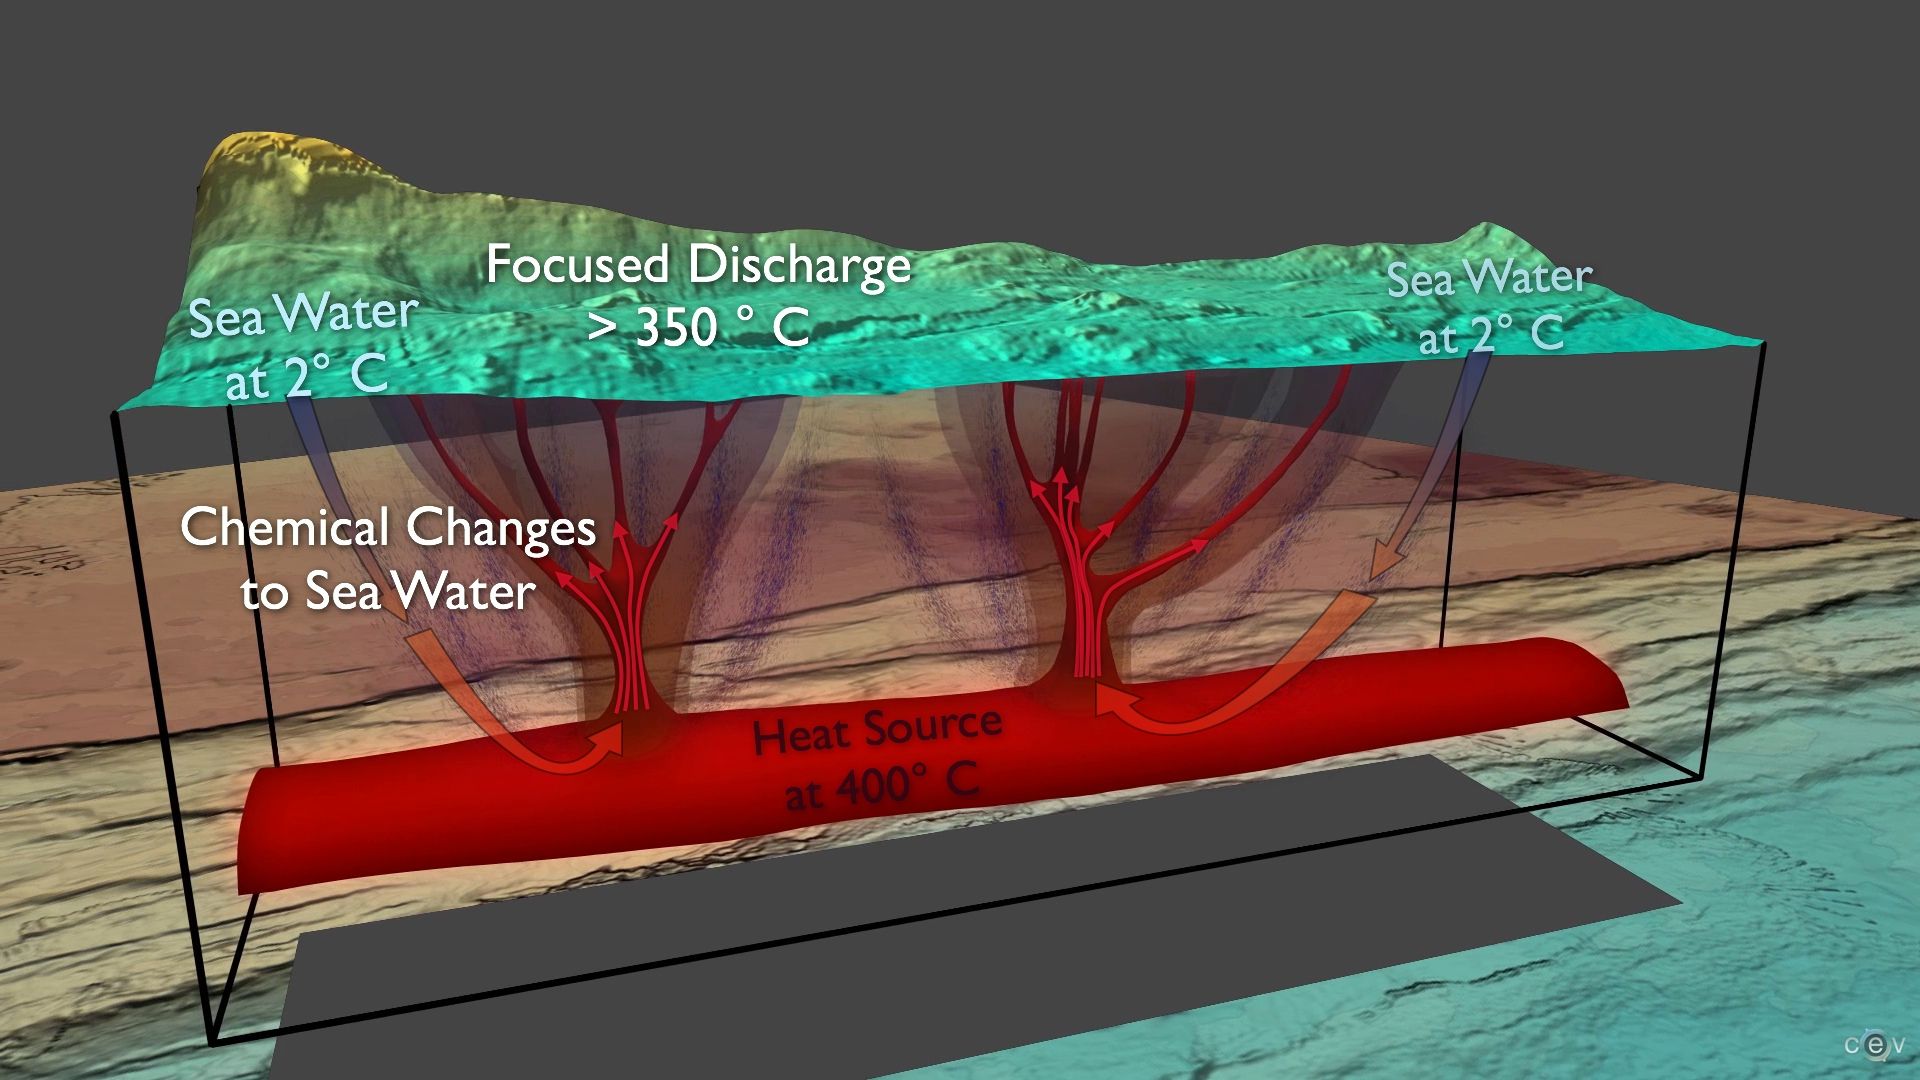
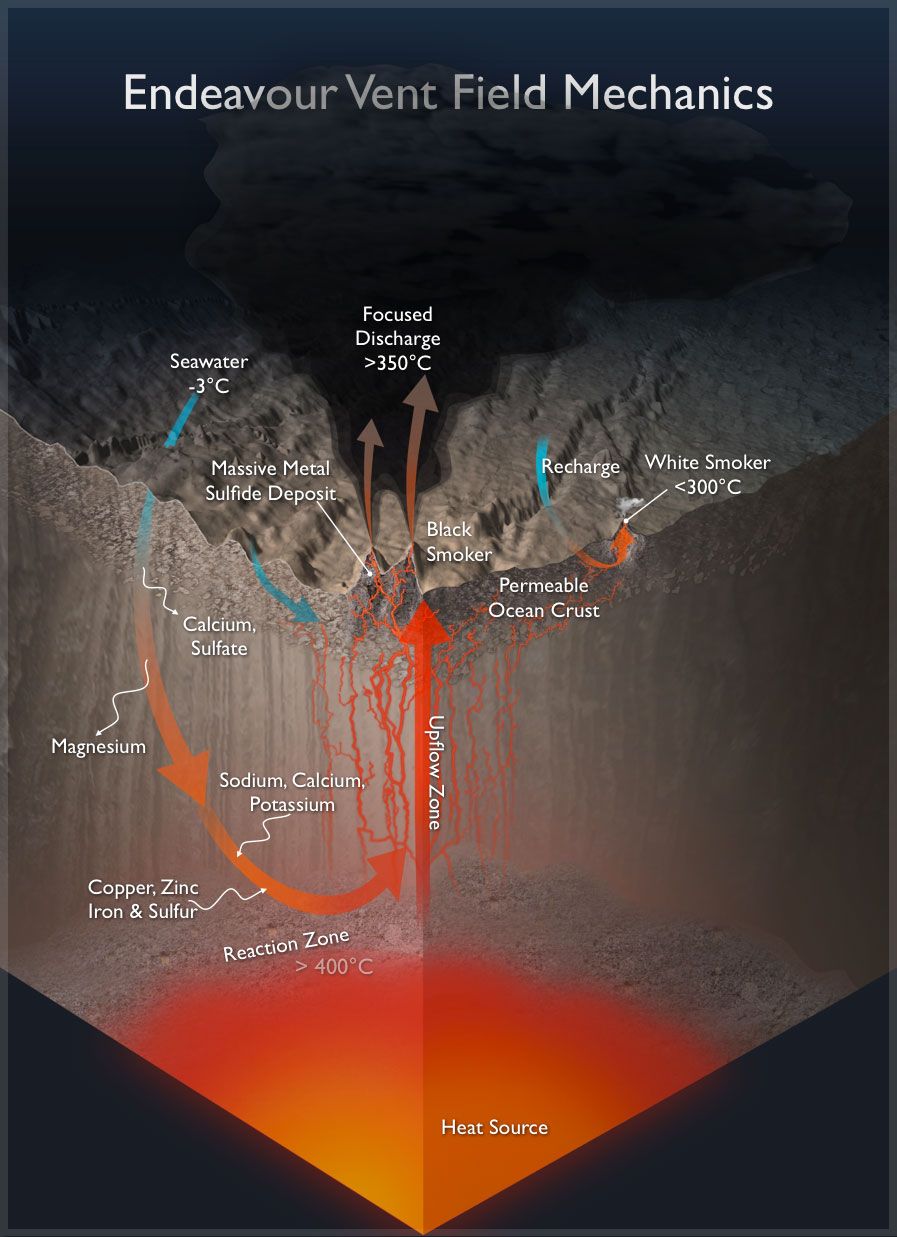
SONAR mapping illustration - CEV collaborated with John Delaney, School of Oceanography, University of Washington on this illustration. Link
×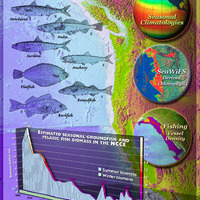
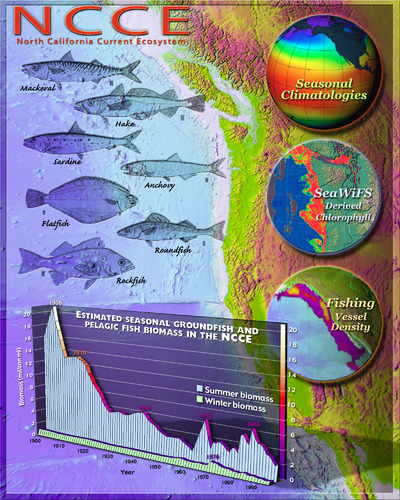
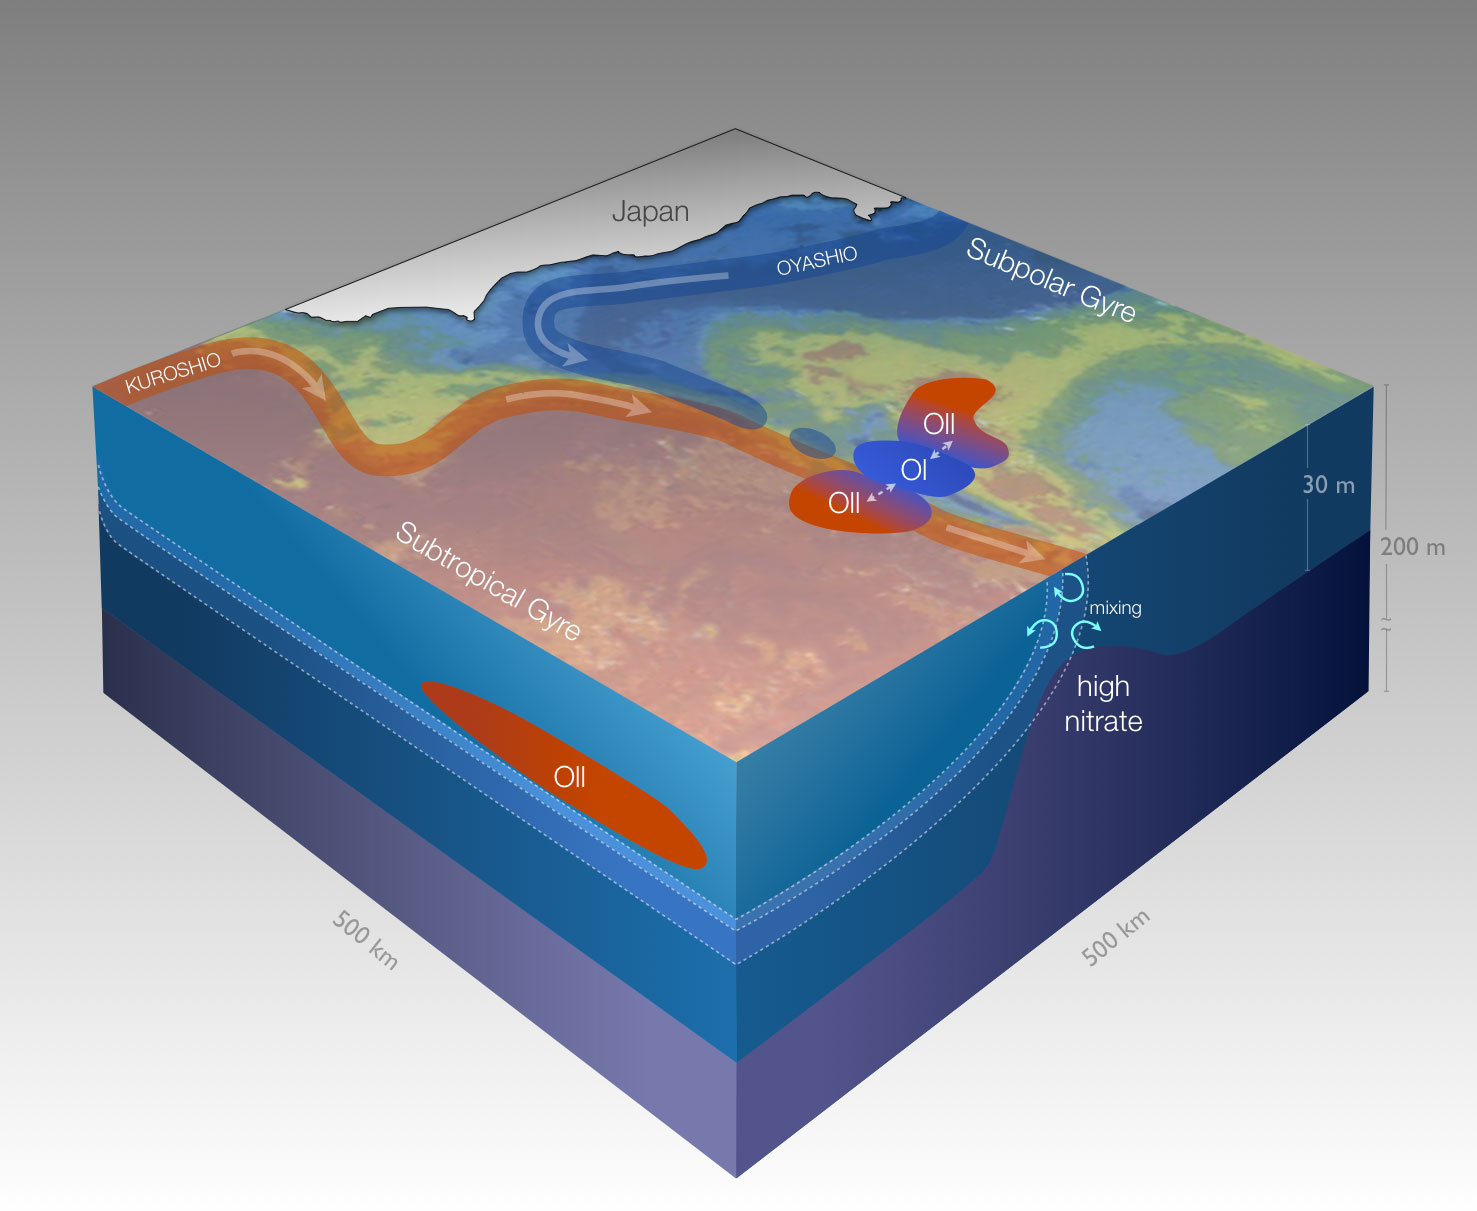
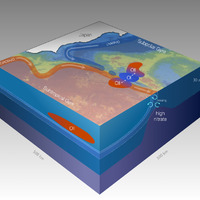
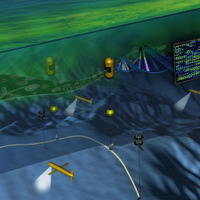
North California Counter Current CEV collaborated on this illustration with Robert Francis, School of Aquatic & Fishery Sciences, Univer Link
×