Slideshow
Converting Earth and Ocean Science data into meaningful visual representations provides insight and understanding of environmental systems

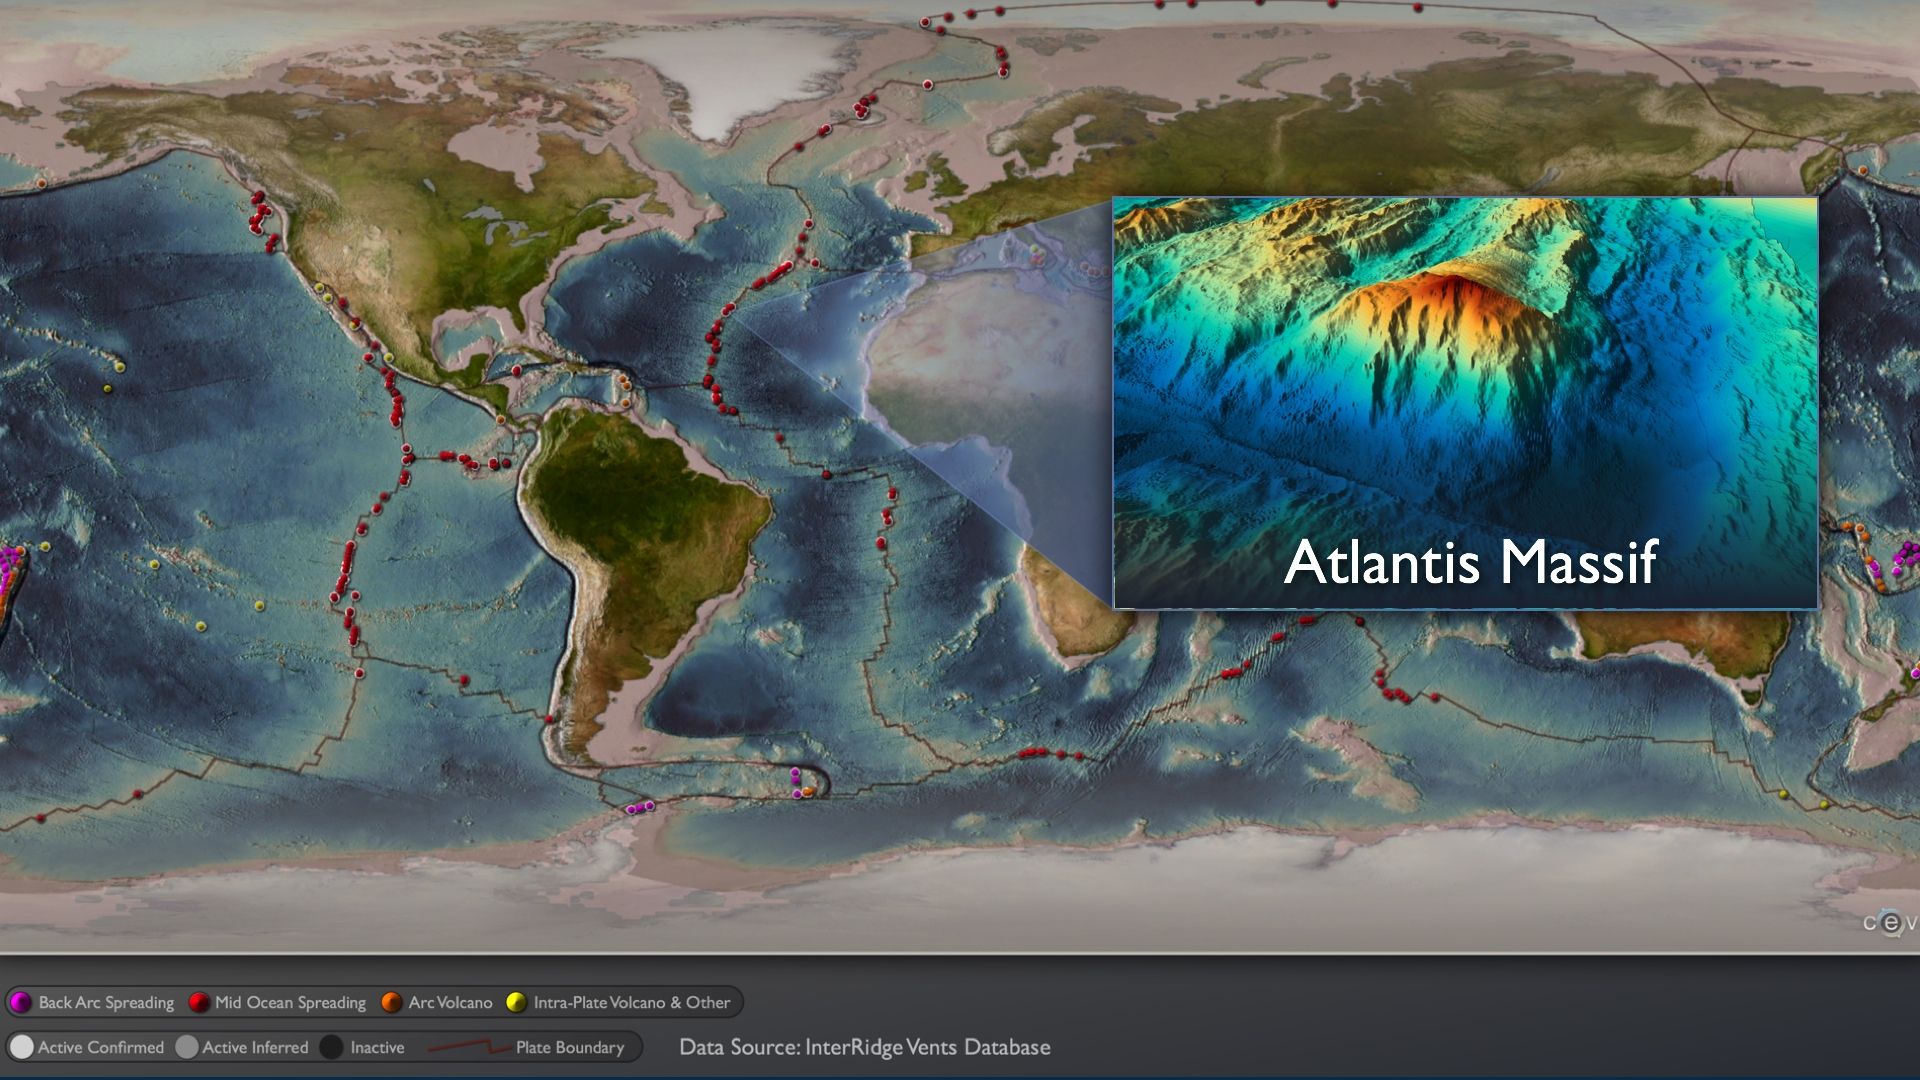
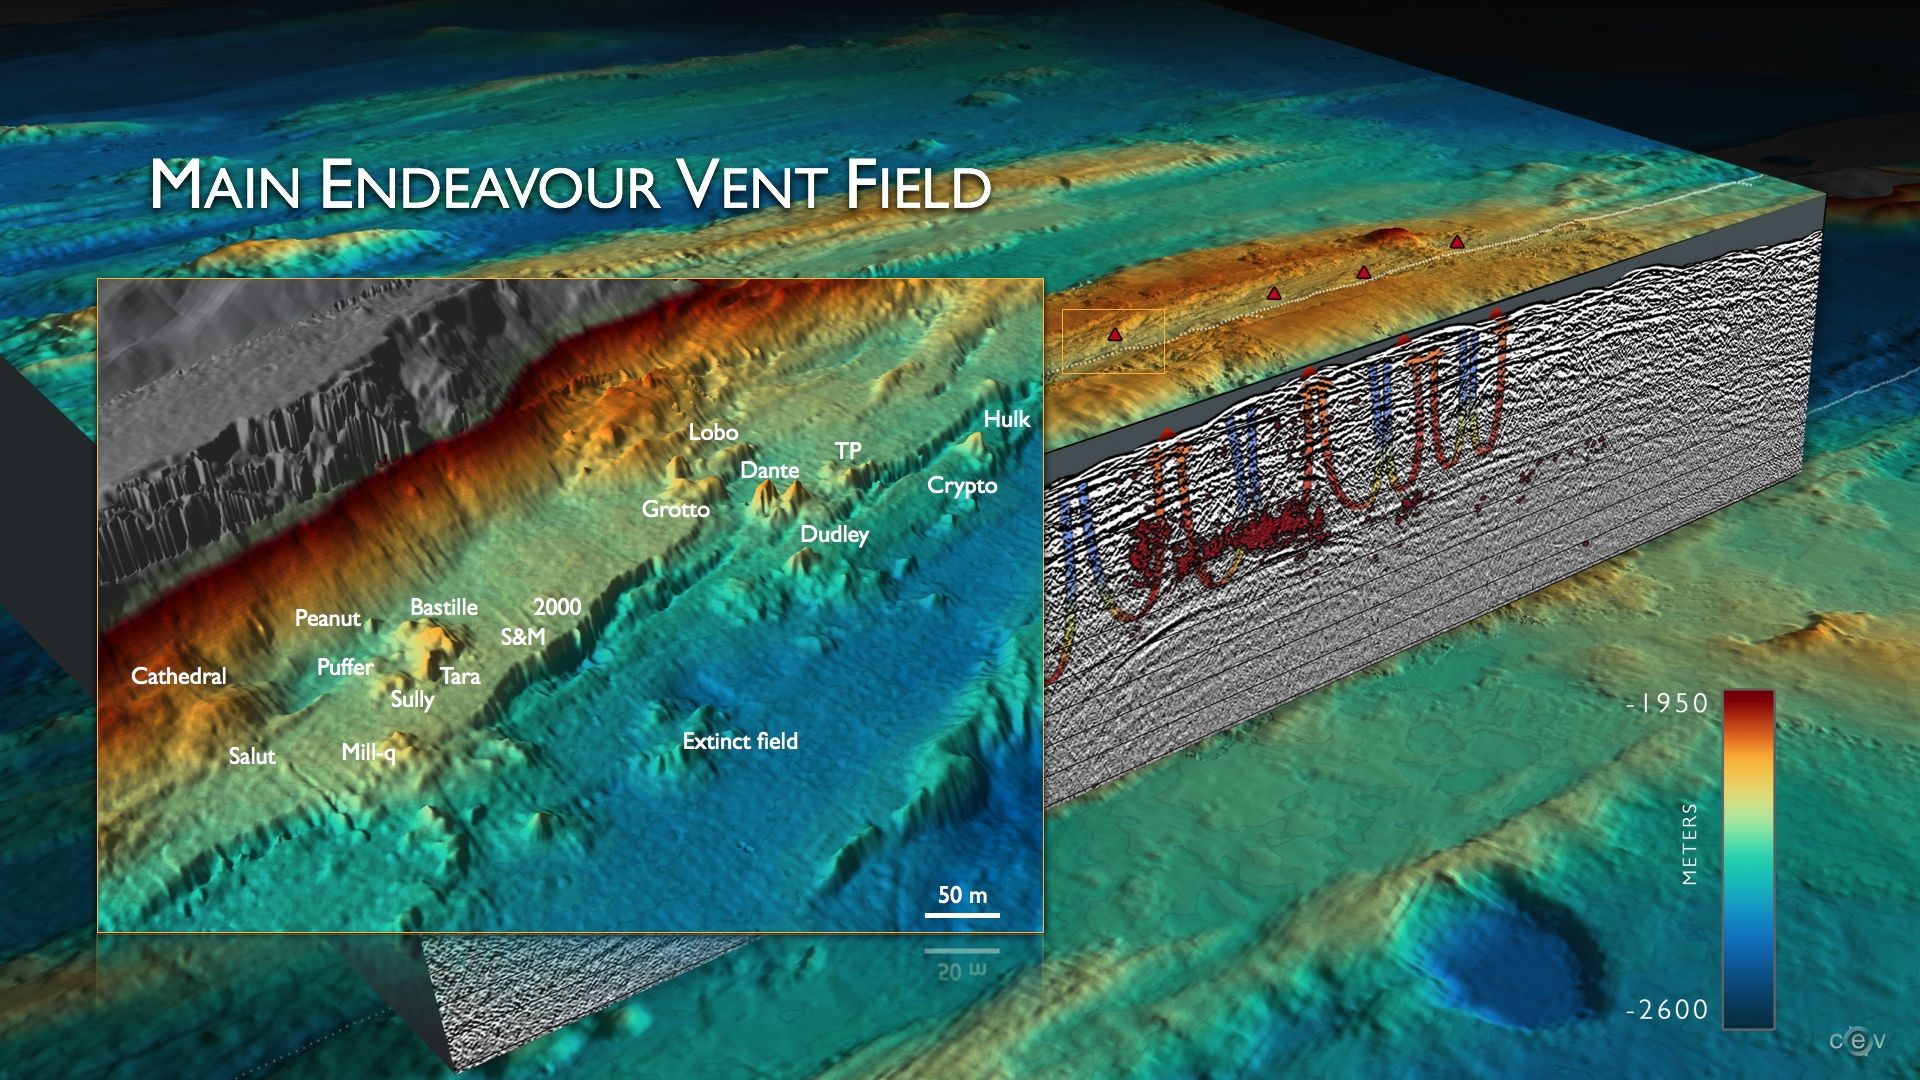
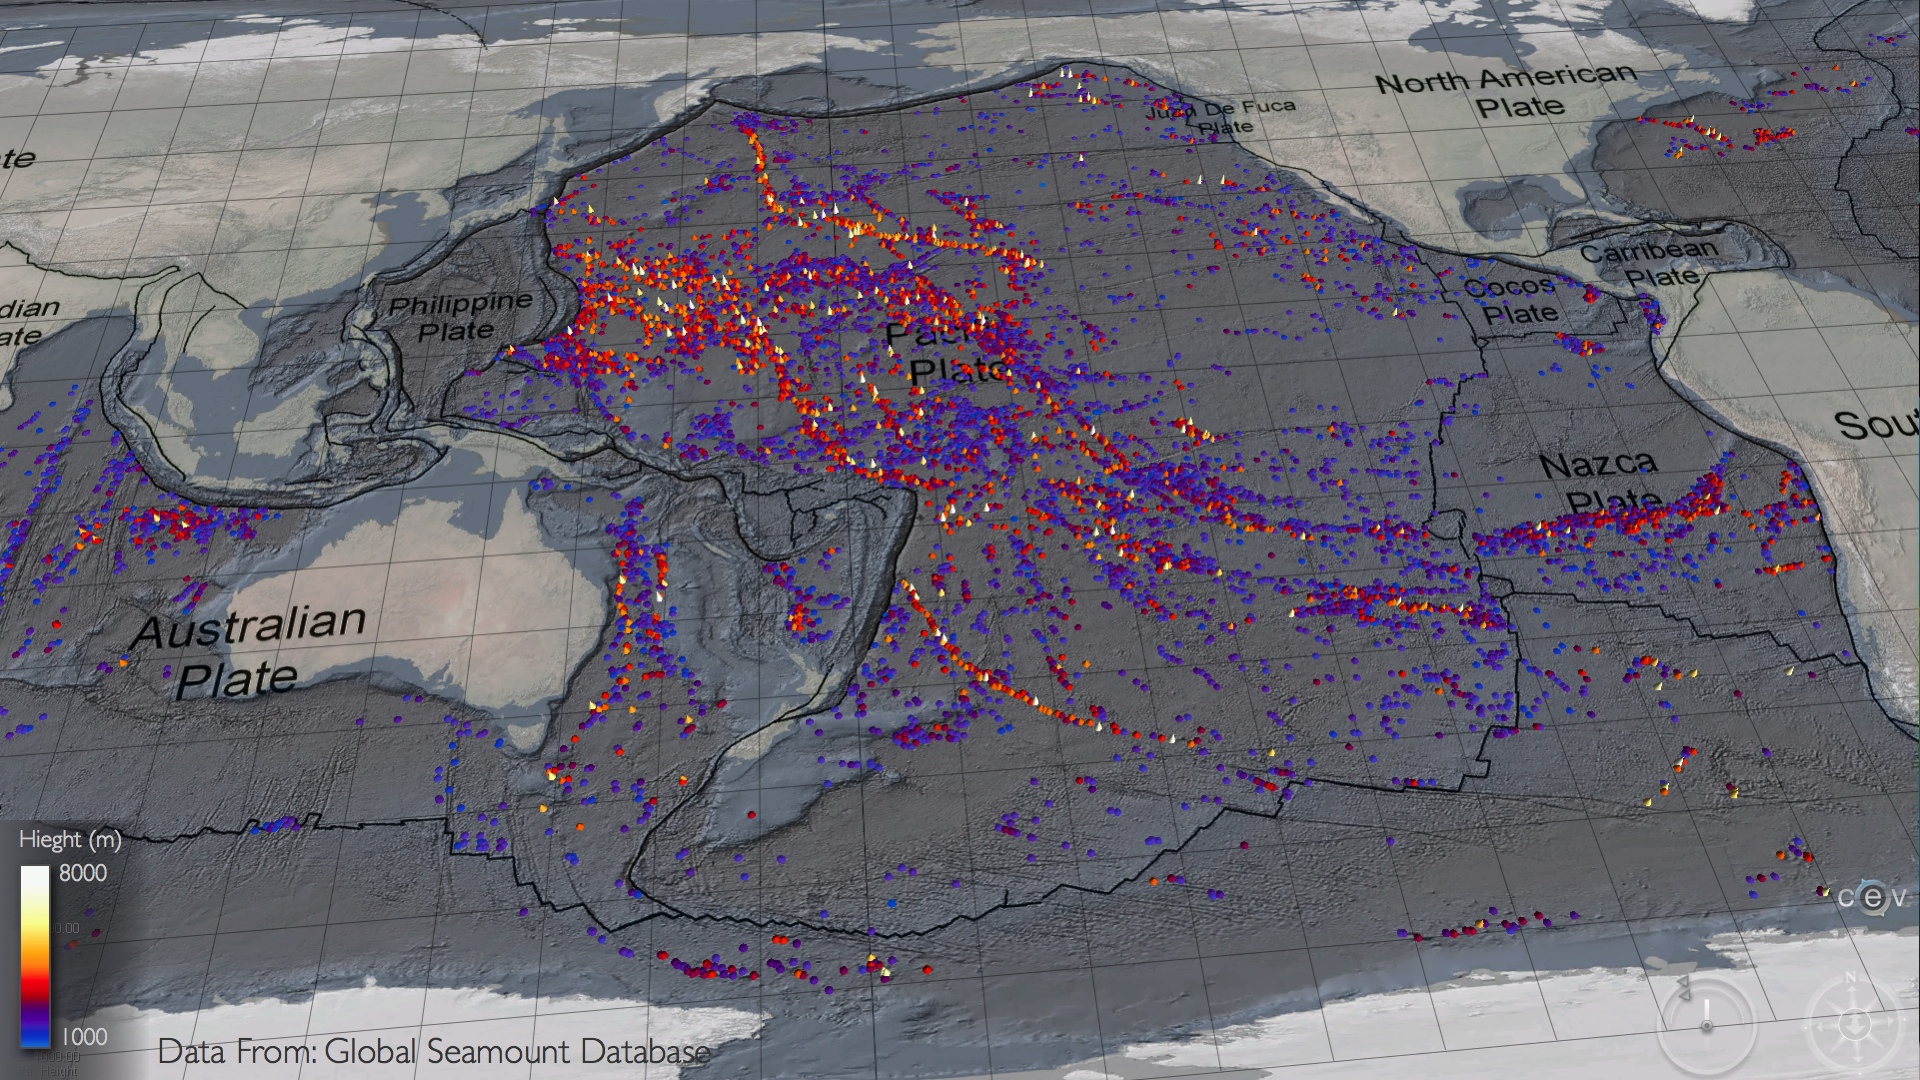
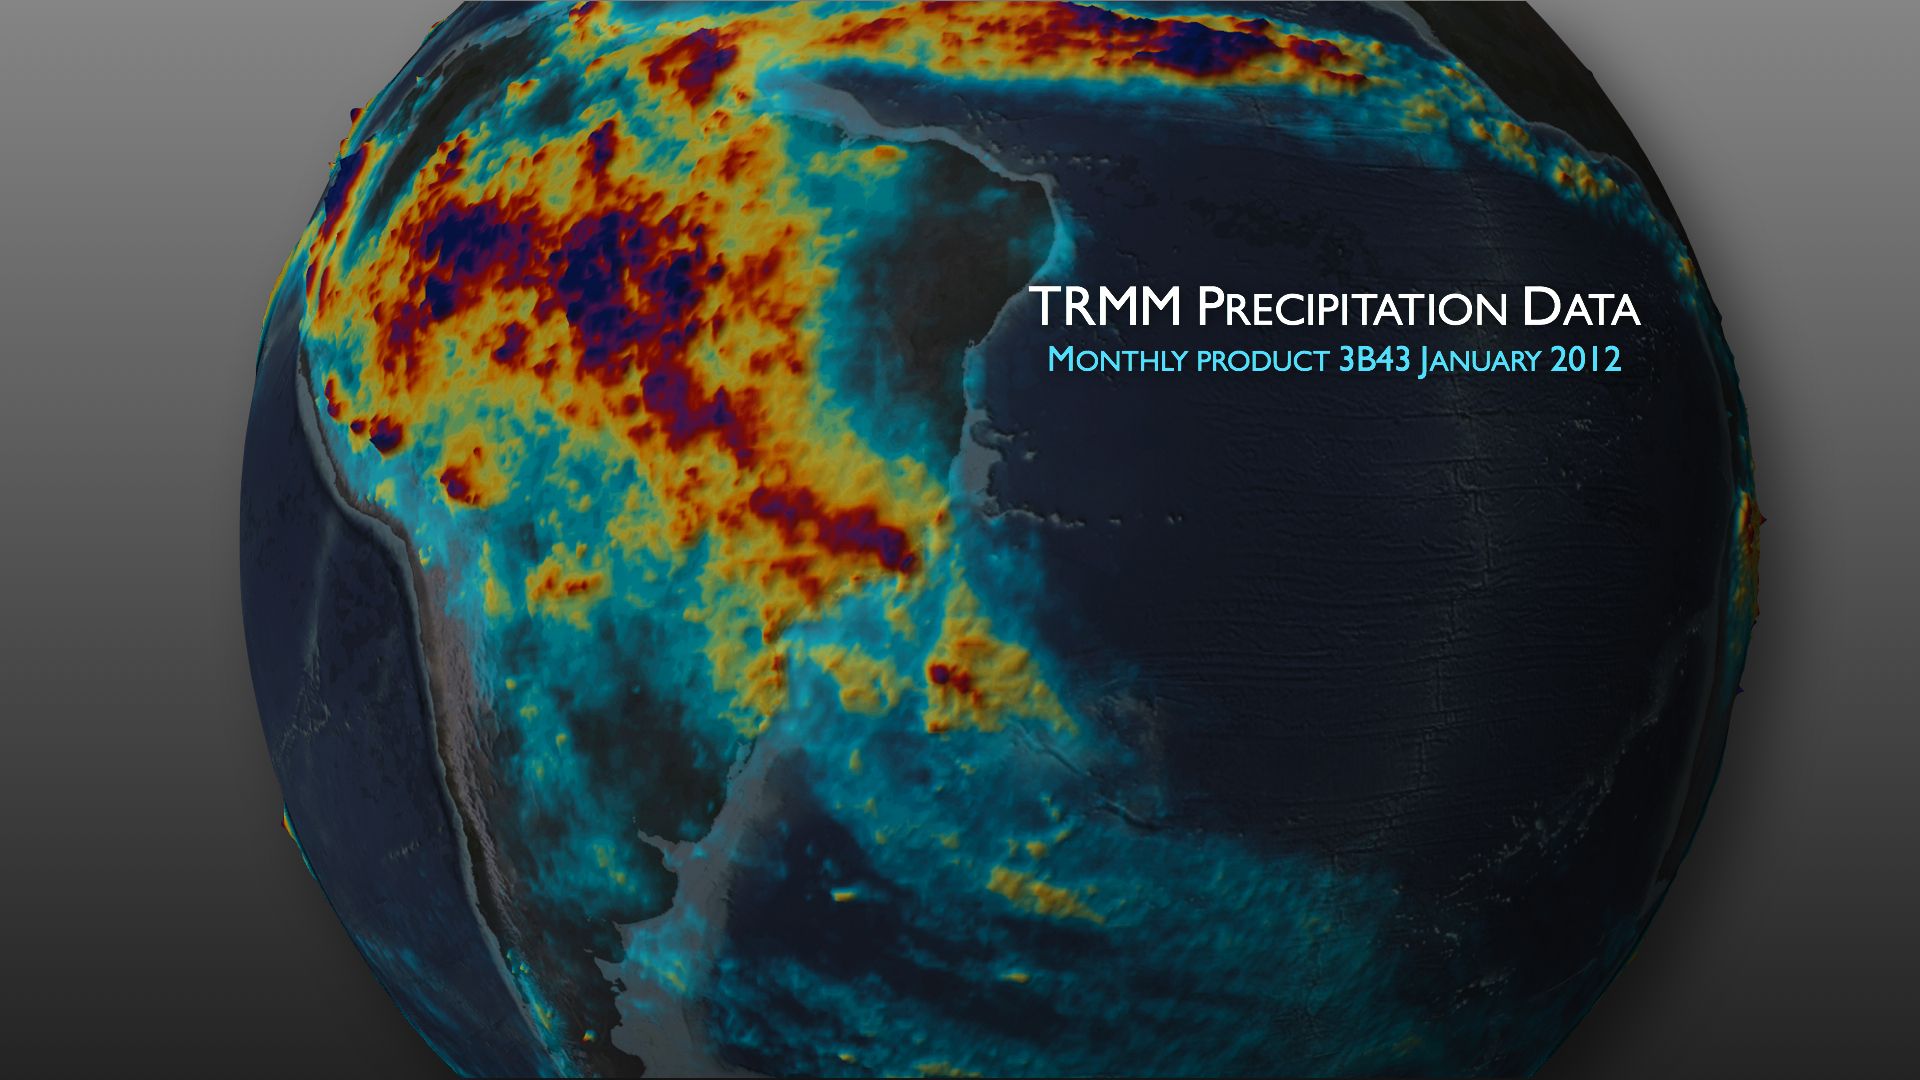
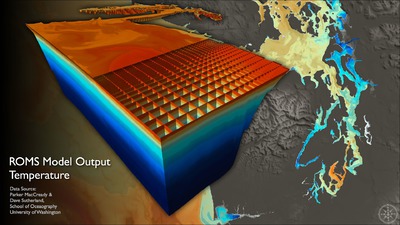
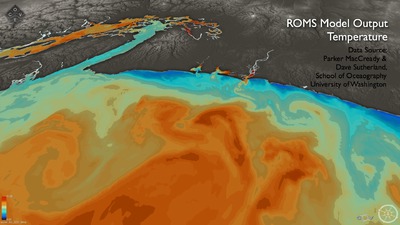
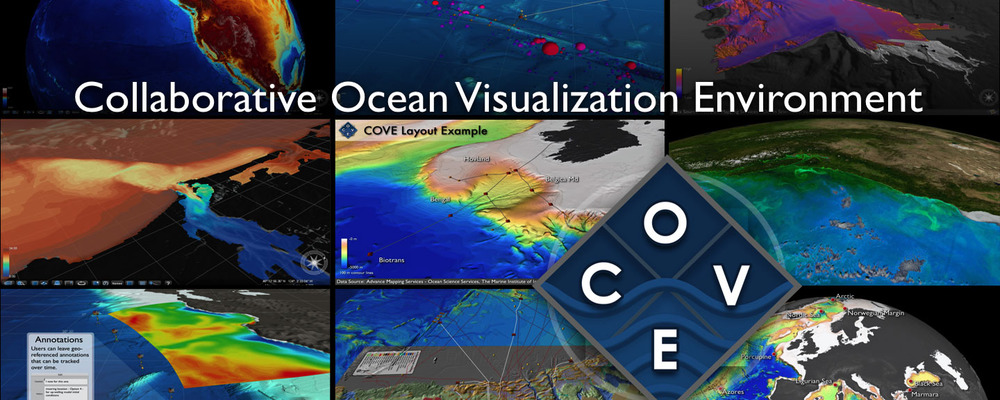
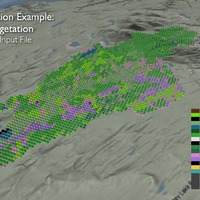
Scientific Visualization converts Earth and Ocean science data into compelling visual representations with high aesthetic and quantitative value. With graphical representations of multi-dimensional science data, CEV provides images and animations that allow scientists to interpret data and communicate their findings. 

Through a masterful application of color theory, text layout, and illustration components, CEV visualizations support narratives that explain and promote science to general and targeted audiences. 

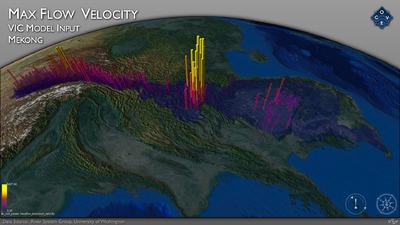
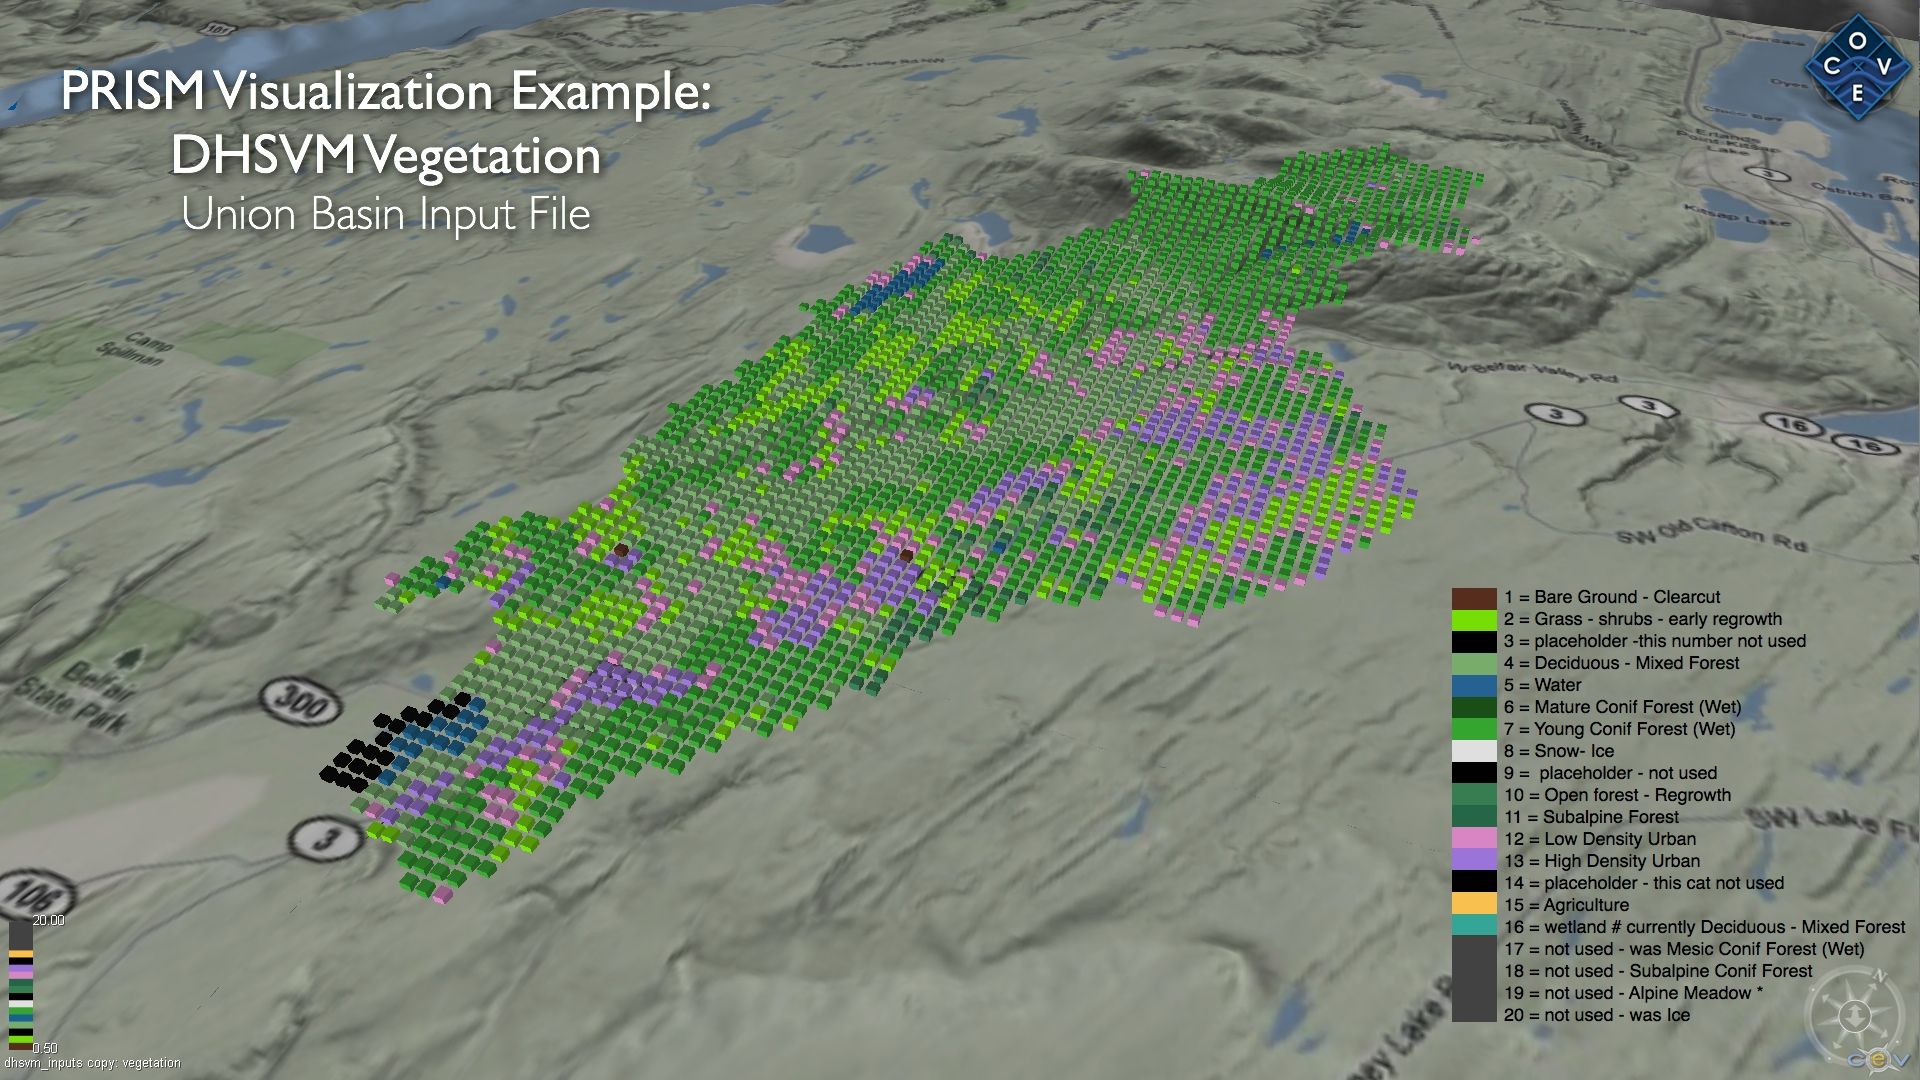
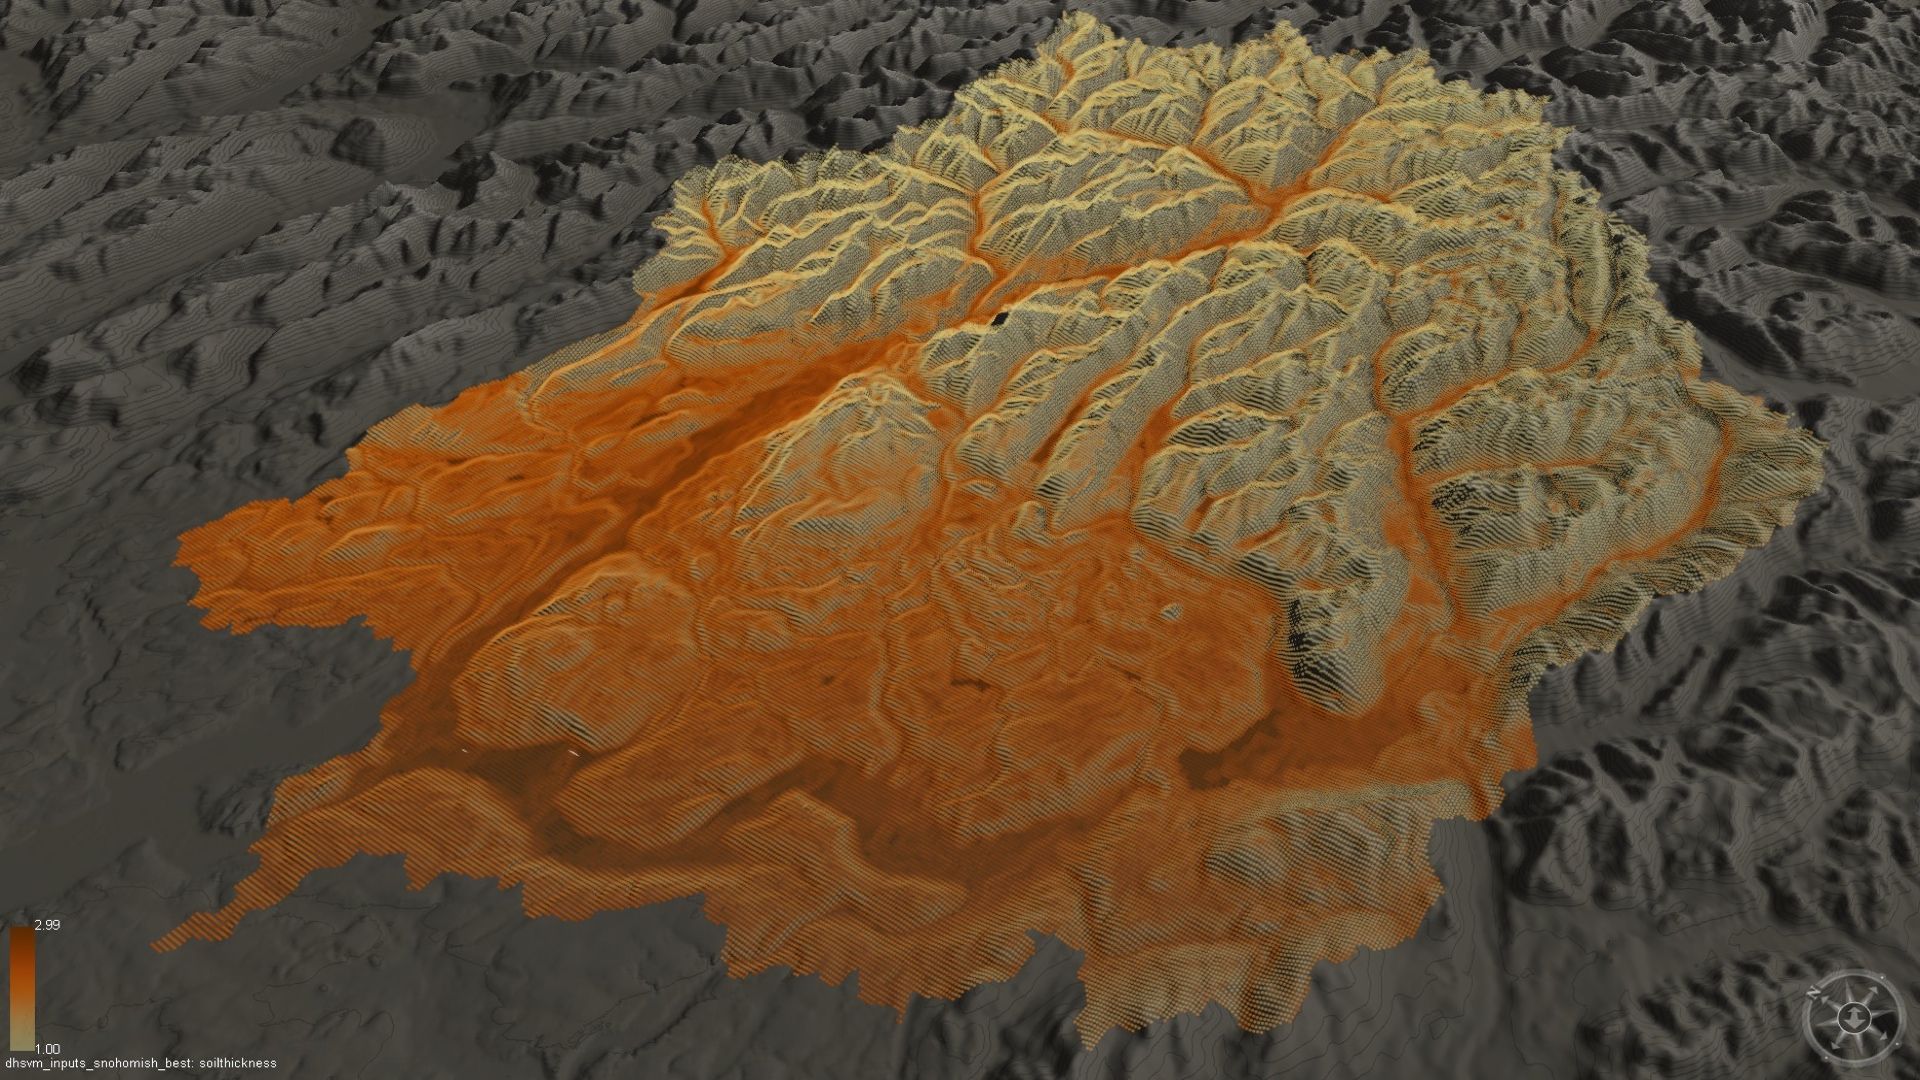
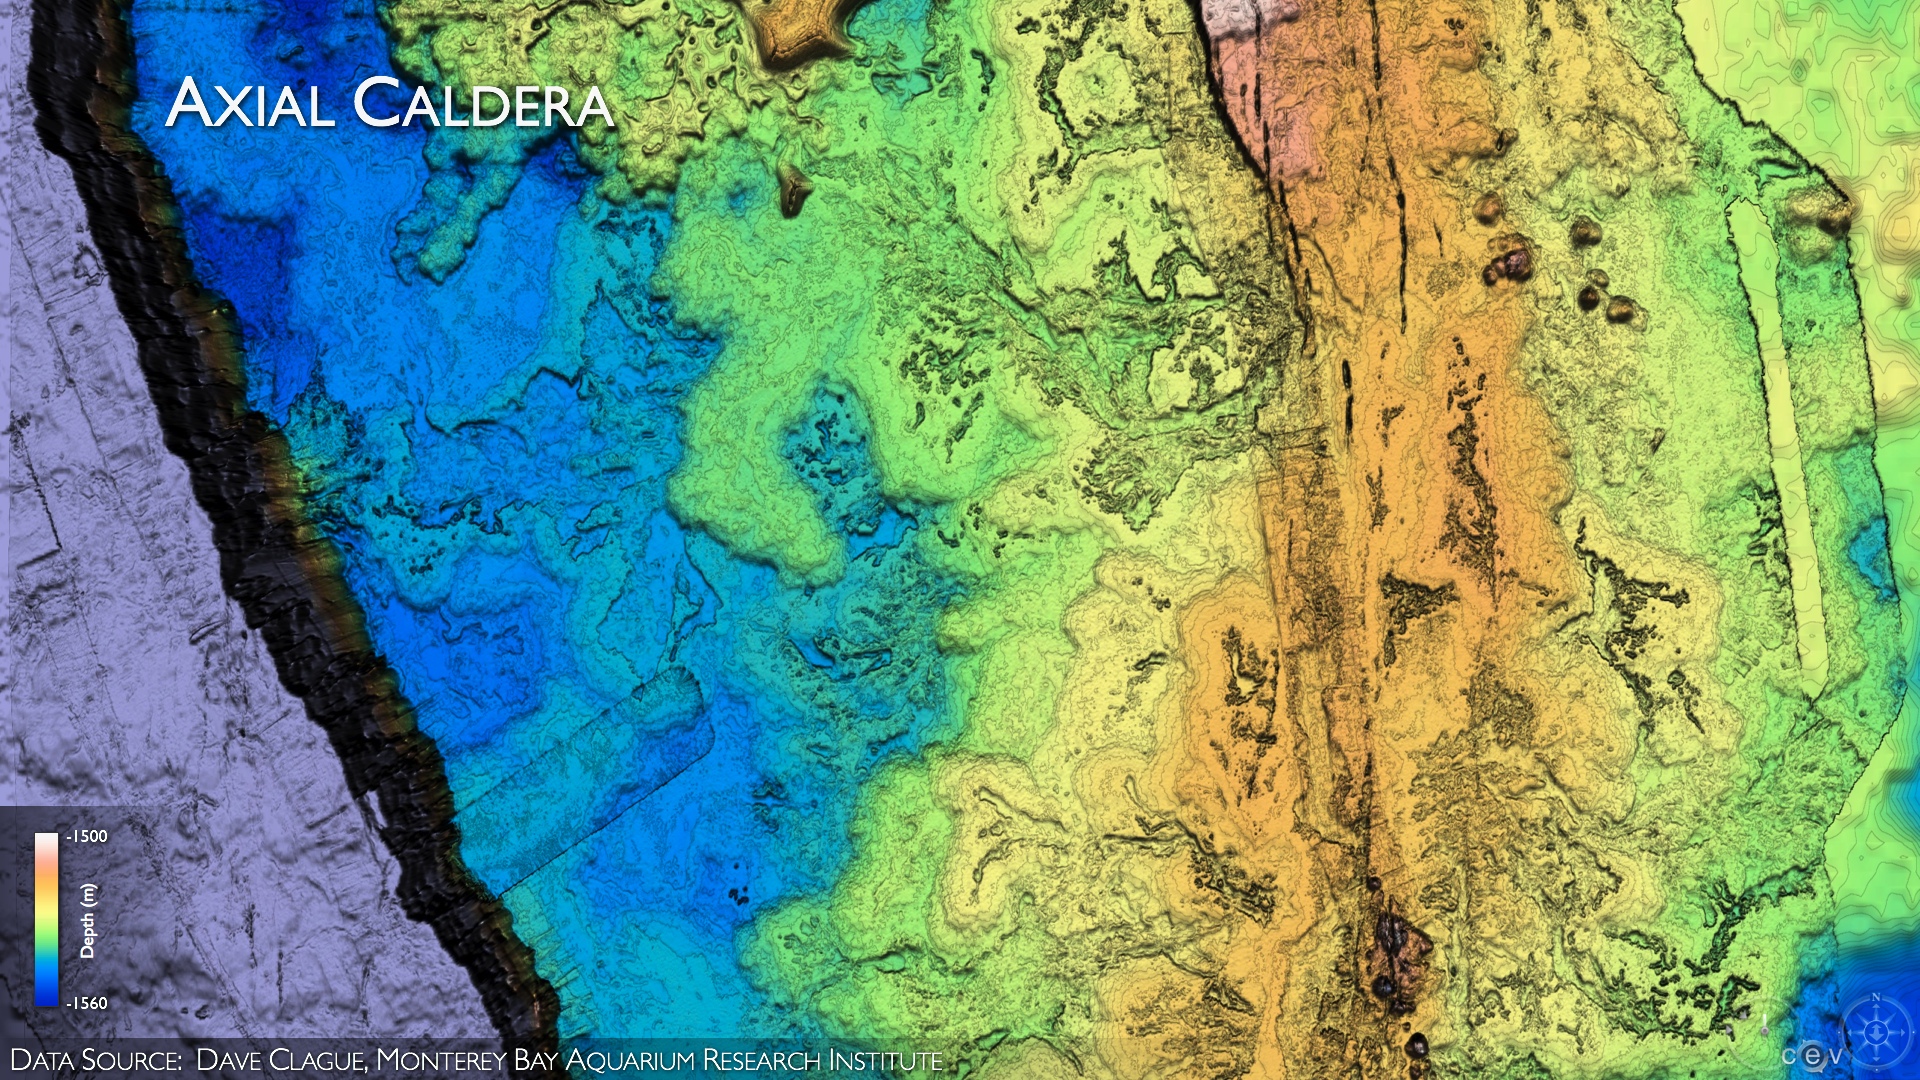
CEV produces Earth and Ocean visuals using scientific visualization software, geographic information systems as well as 3D modeling software.  Final visualizations are often combined with additonal graphics using presentation packages and video editing software.

Converting Earth and Ocean Science data into meaningful visual representations provides insight and understanding of environmental systems

Related Stories

Related Images

  • DONET DONET II and S Net Cable Configurations

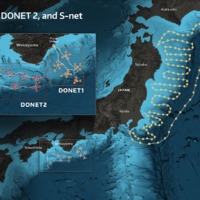
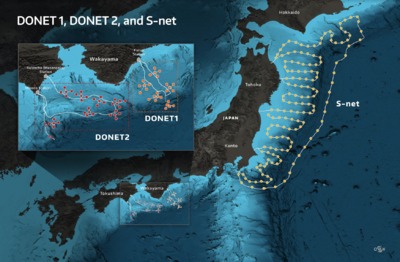
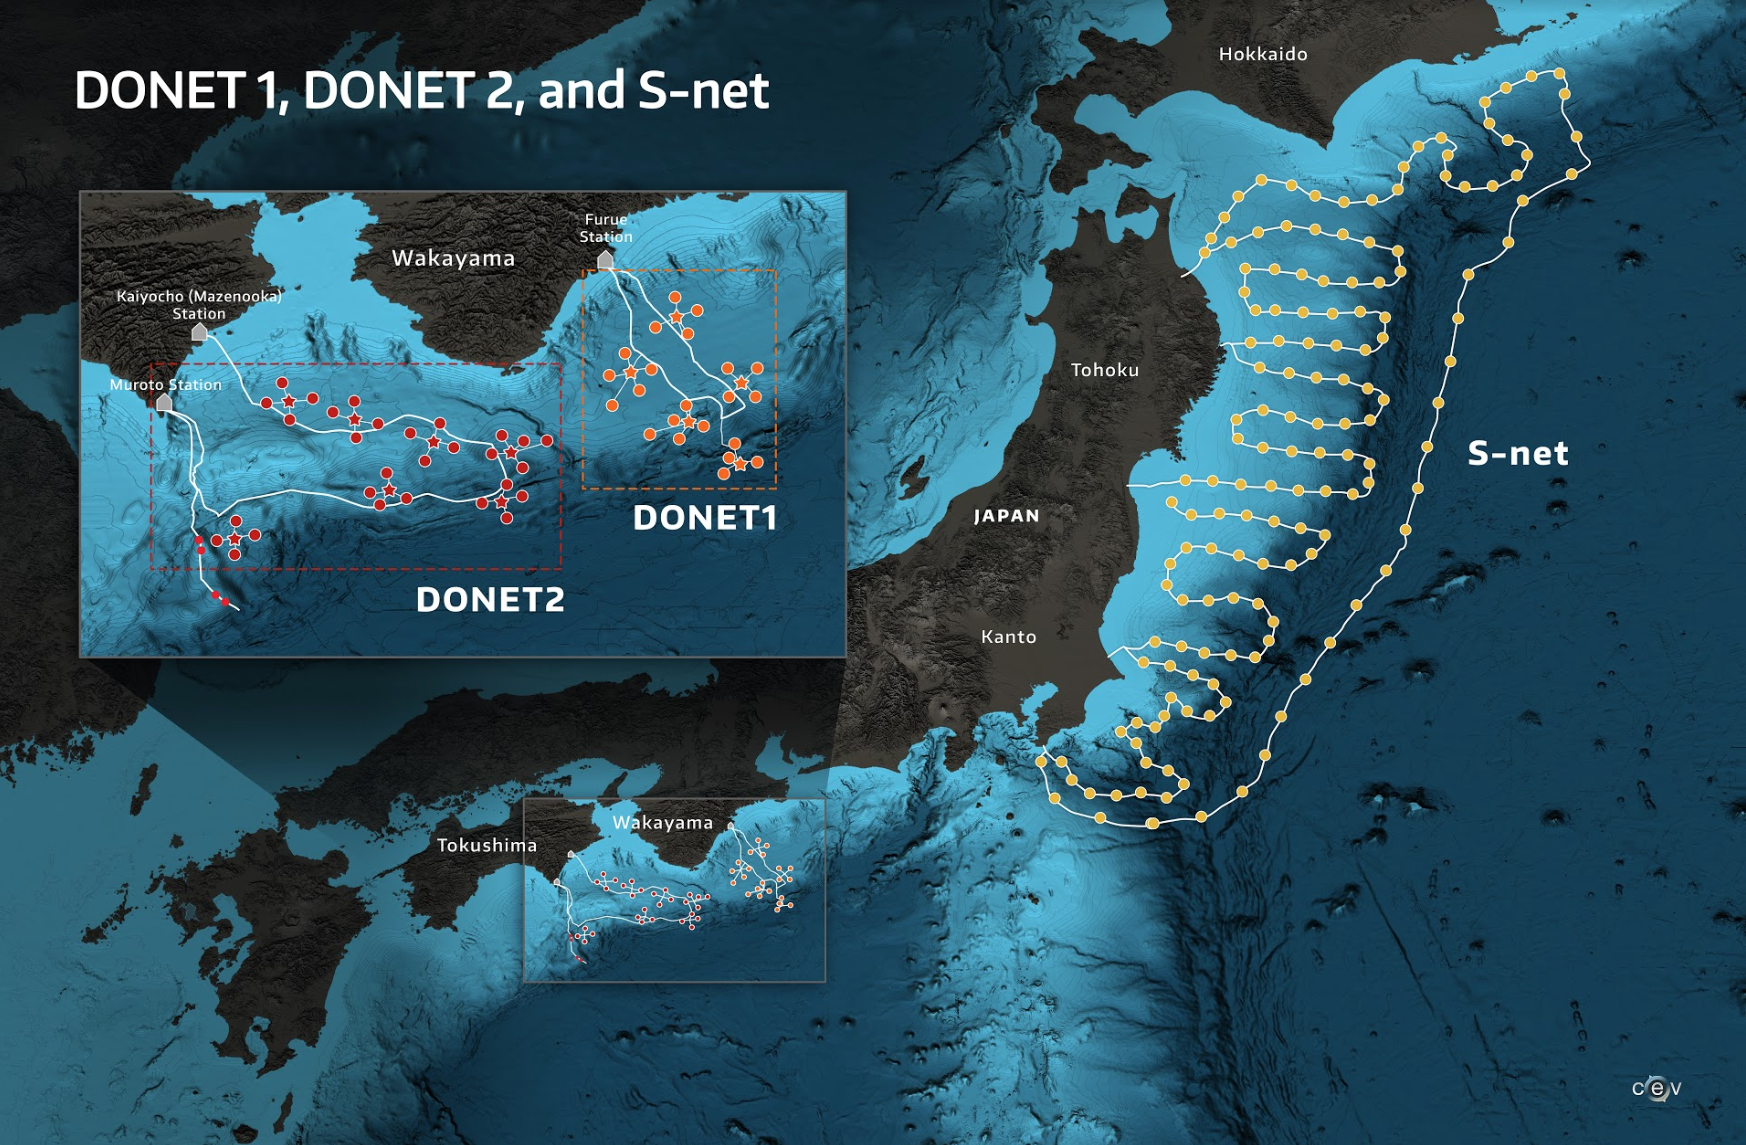
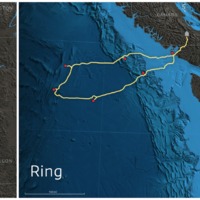
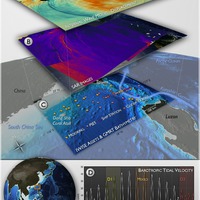
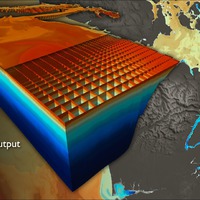
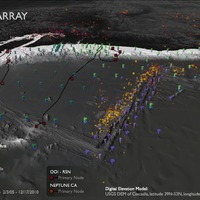
    The DONET (Dense Oceanfloor Network System for Earthquakes and Tsunamis) observatory was developed by JAMSTEC (Japan Agency for Marine-Earth Sc Link

    ×
  • Cabled observatory topology options.

    The cable (yellow) connects nodes (red) where instruments are attached. Link

    ×
  • Example for a Cabled Early Warning System

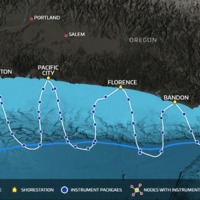
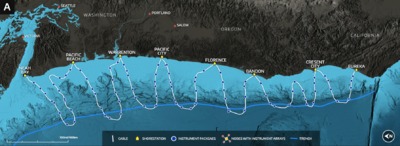
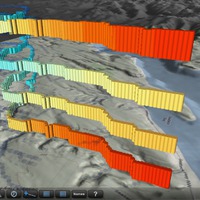
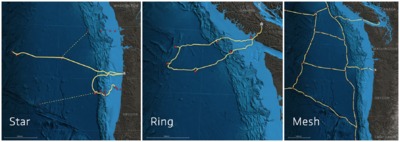
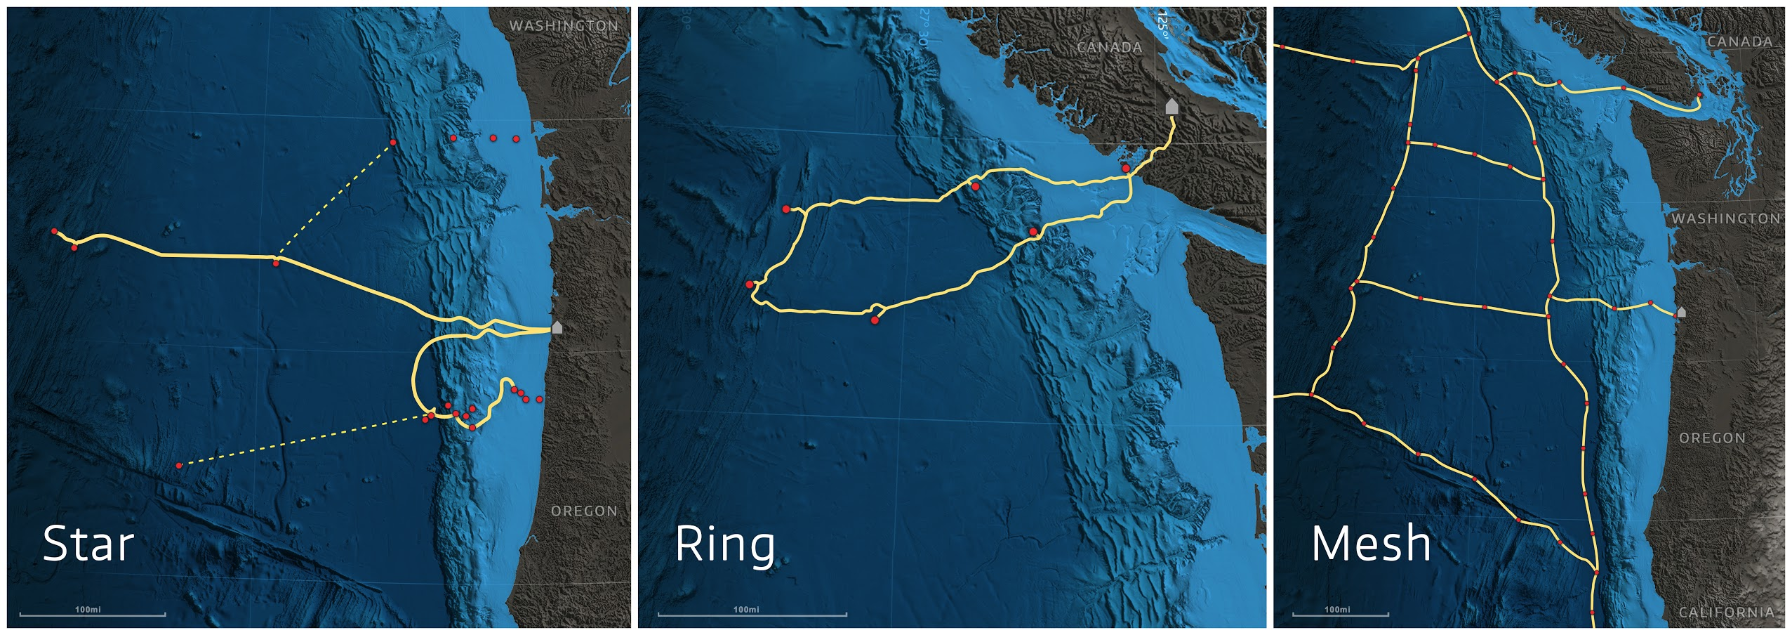
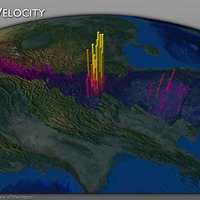
    Installation costs for a representative hardwired and connectorized EEW/TEW system can be estimated by assuming the topology and number of sh Link

    ×
  • The Pacific Northwest with geological overview map

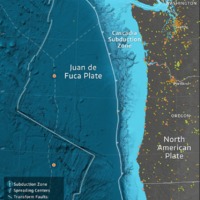
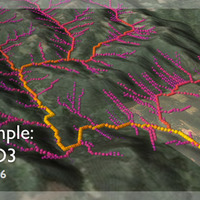
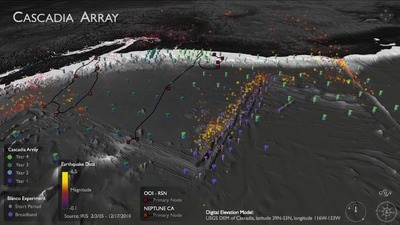
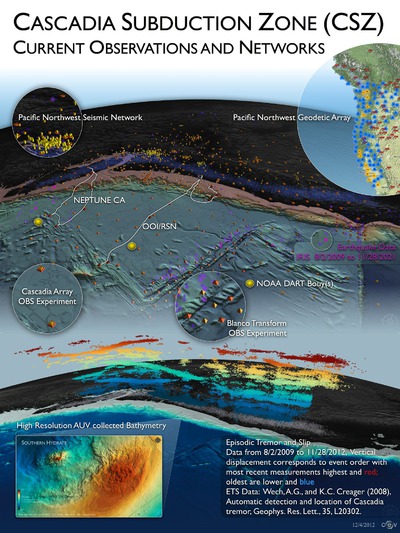
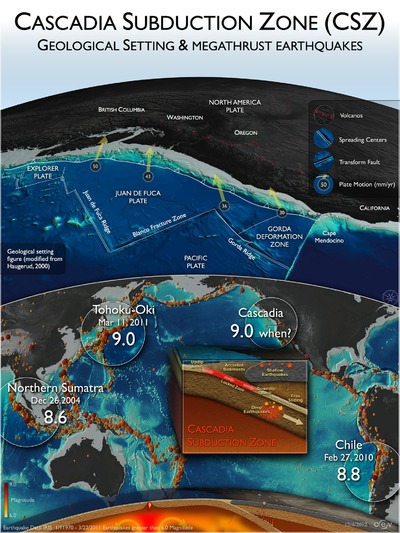
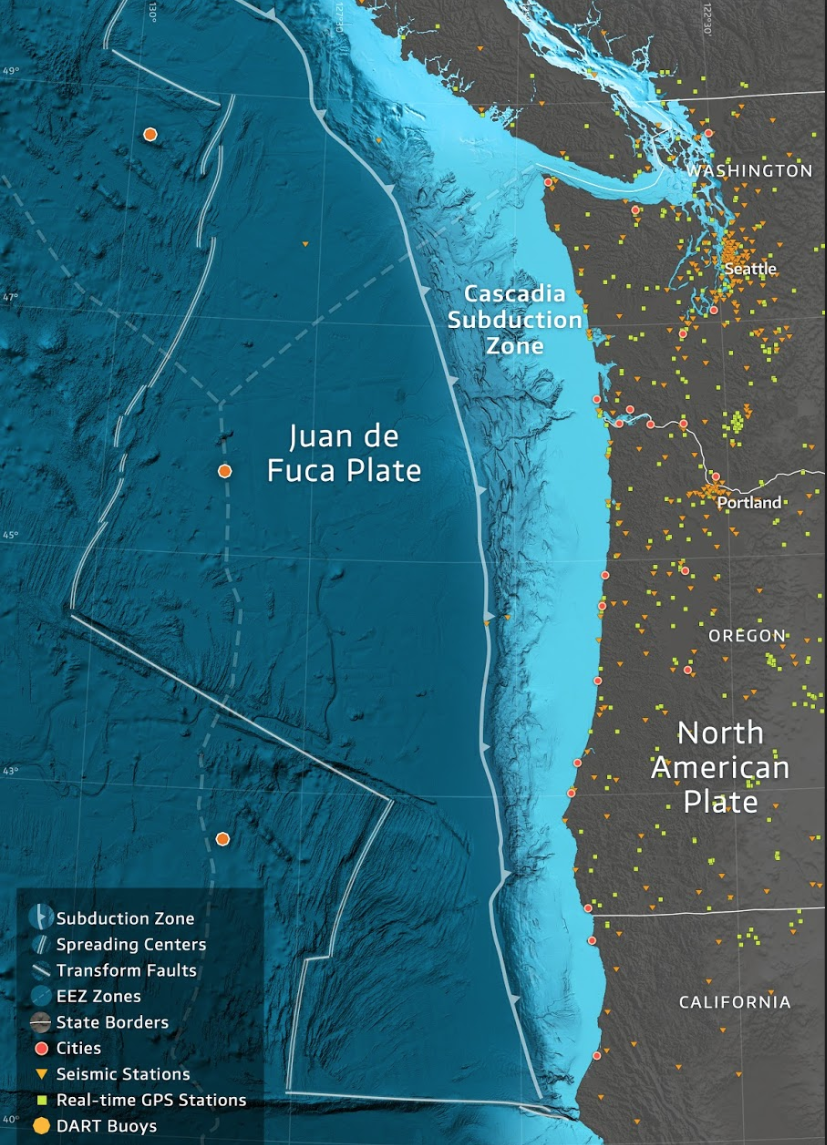
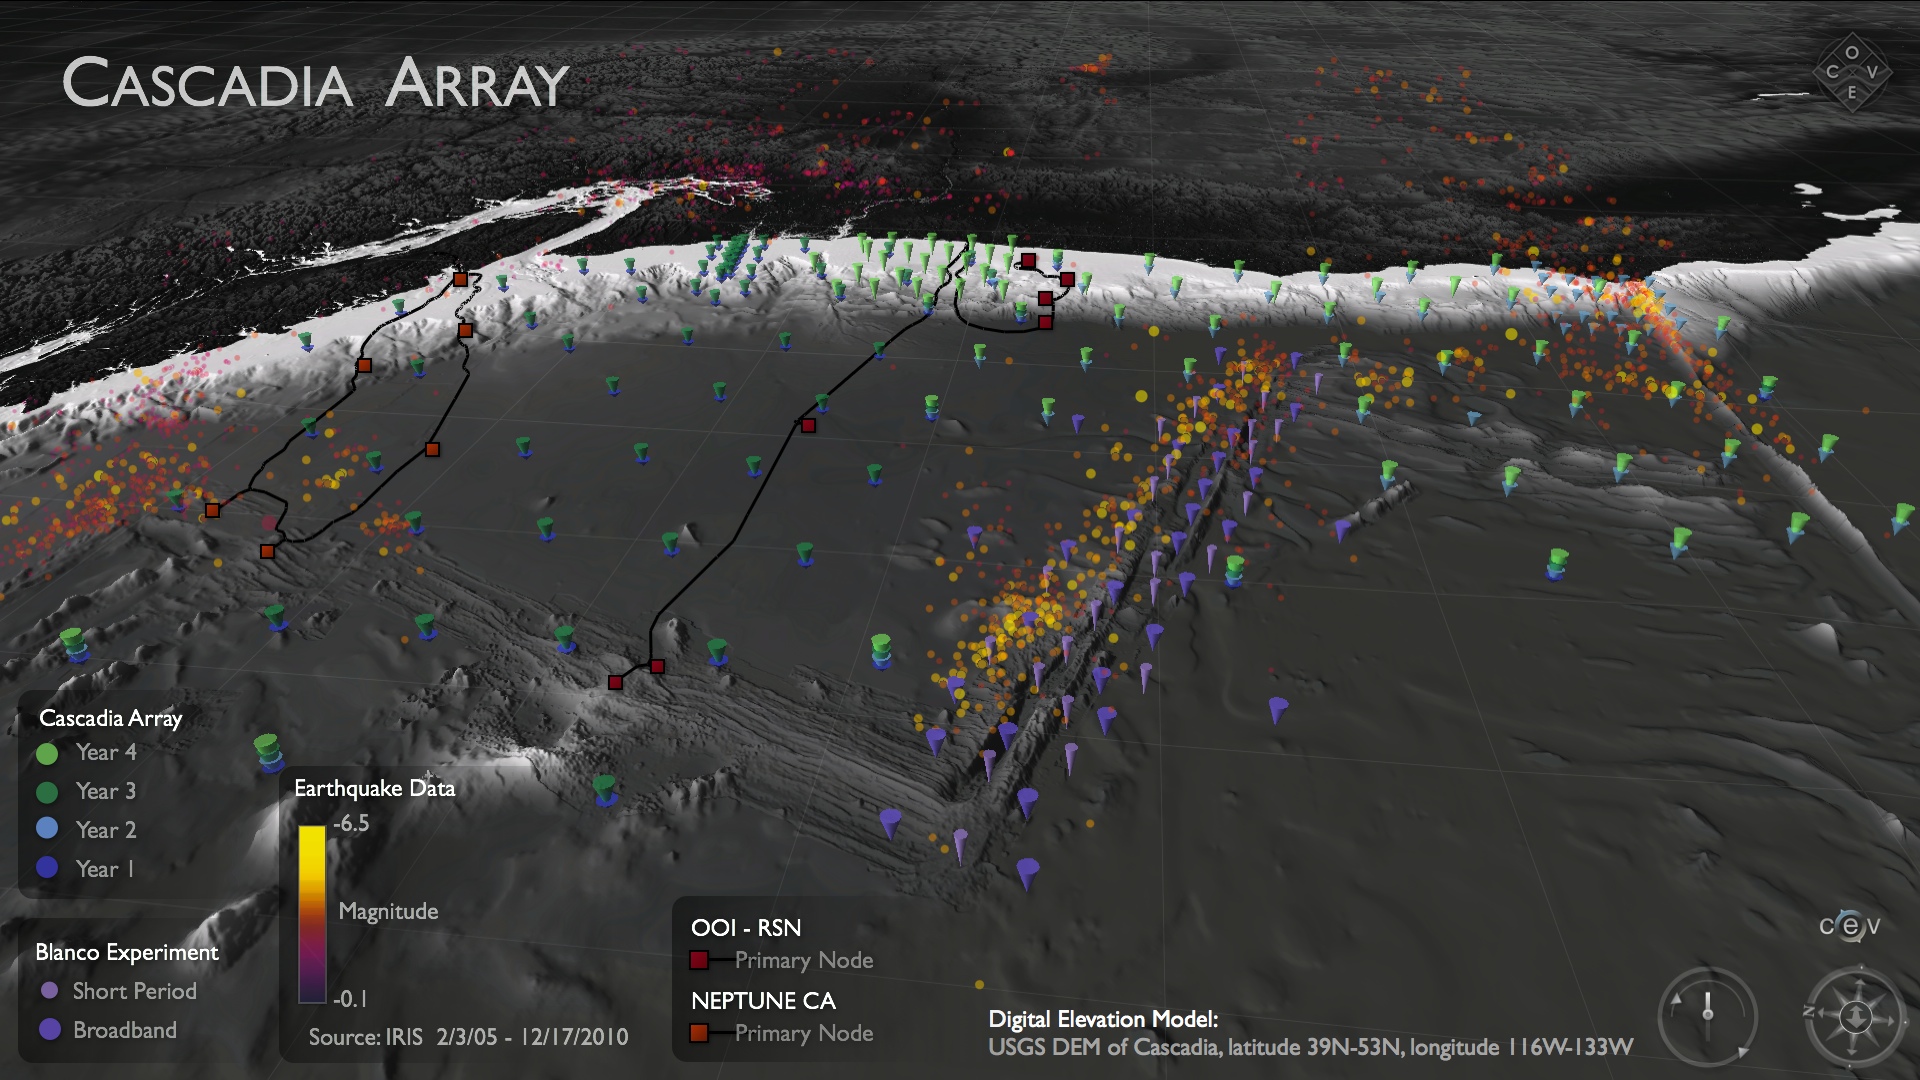
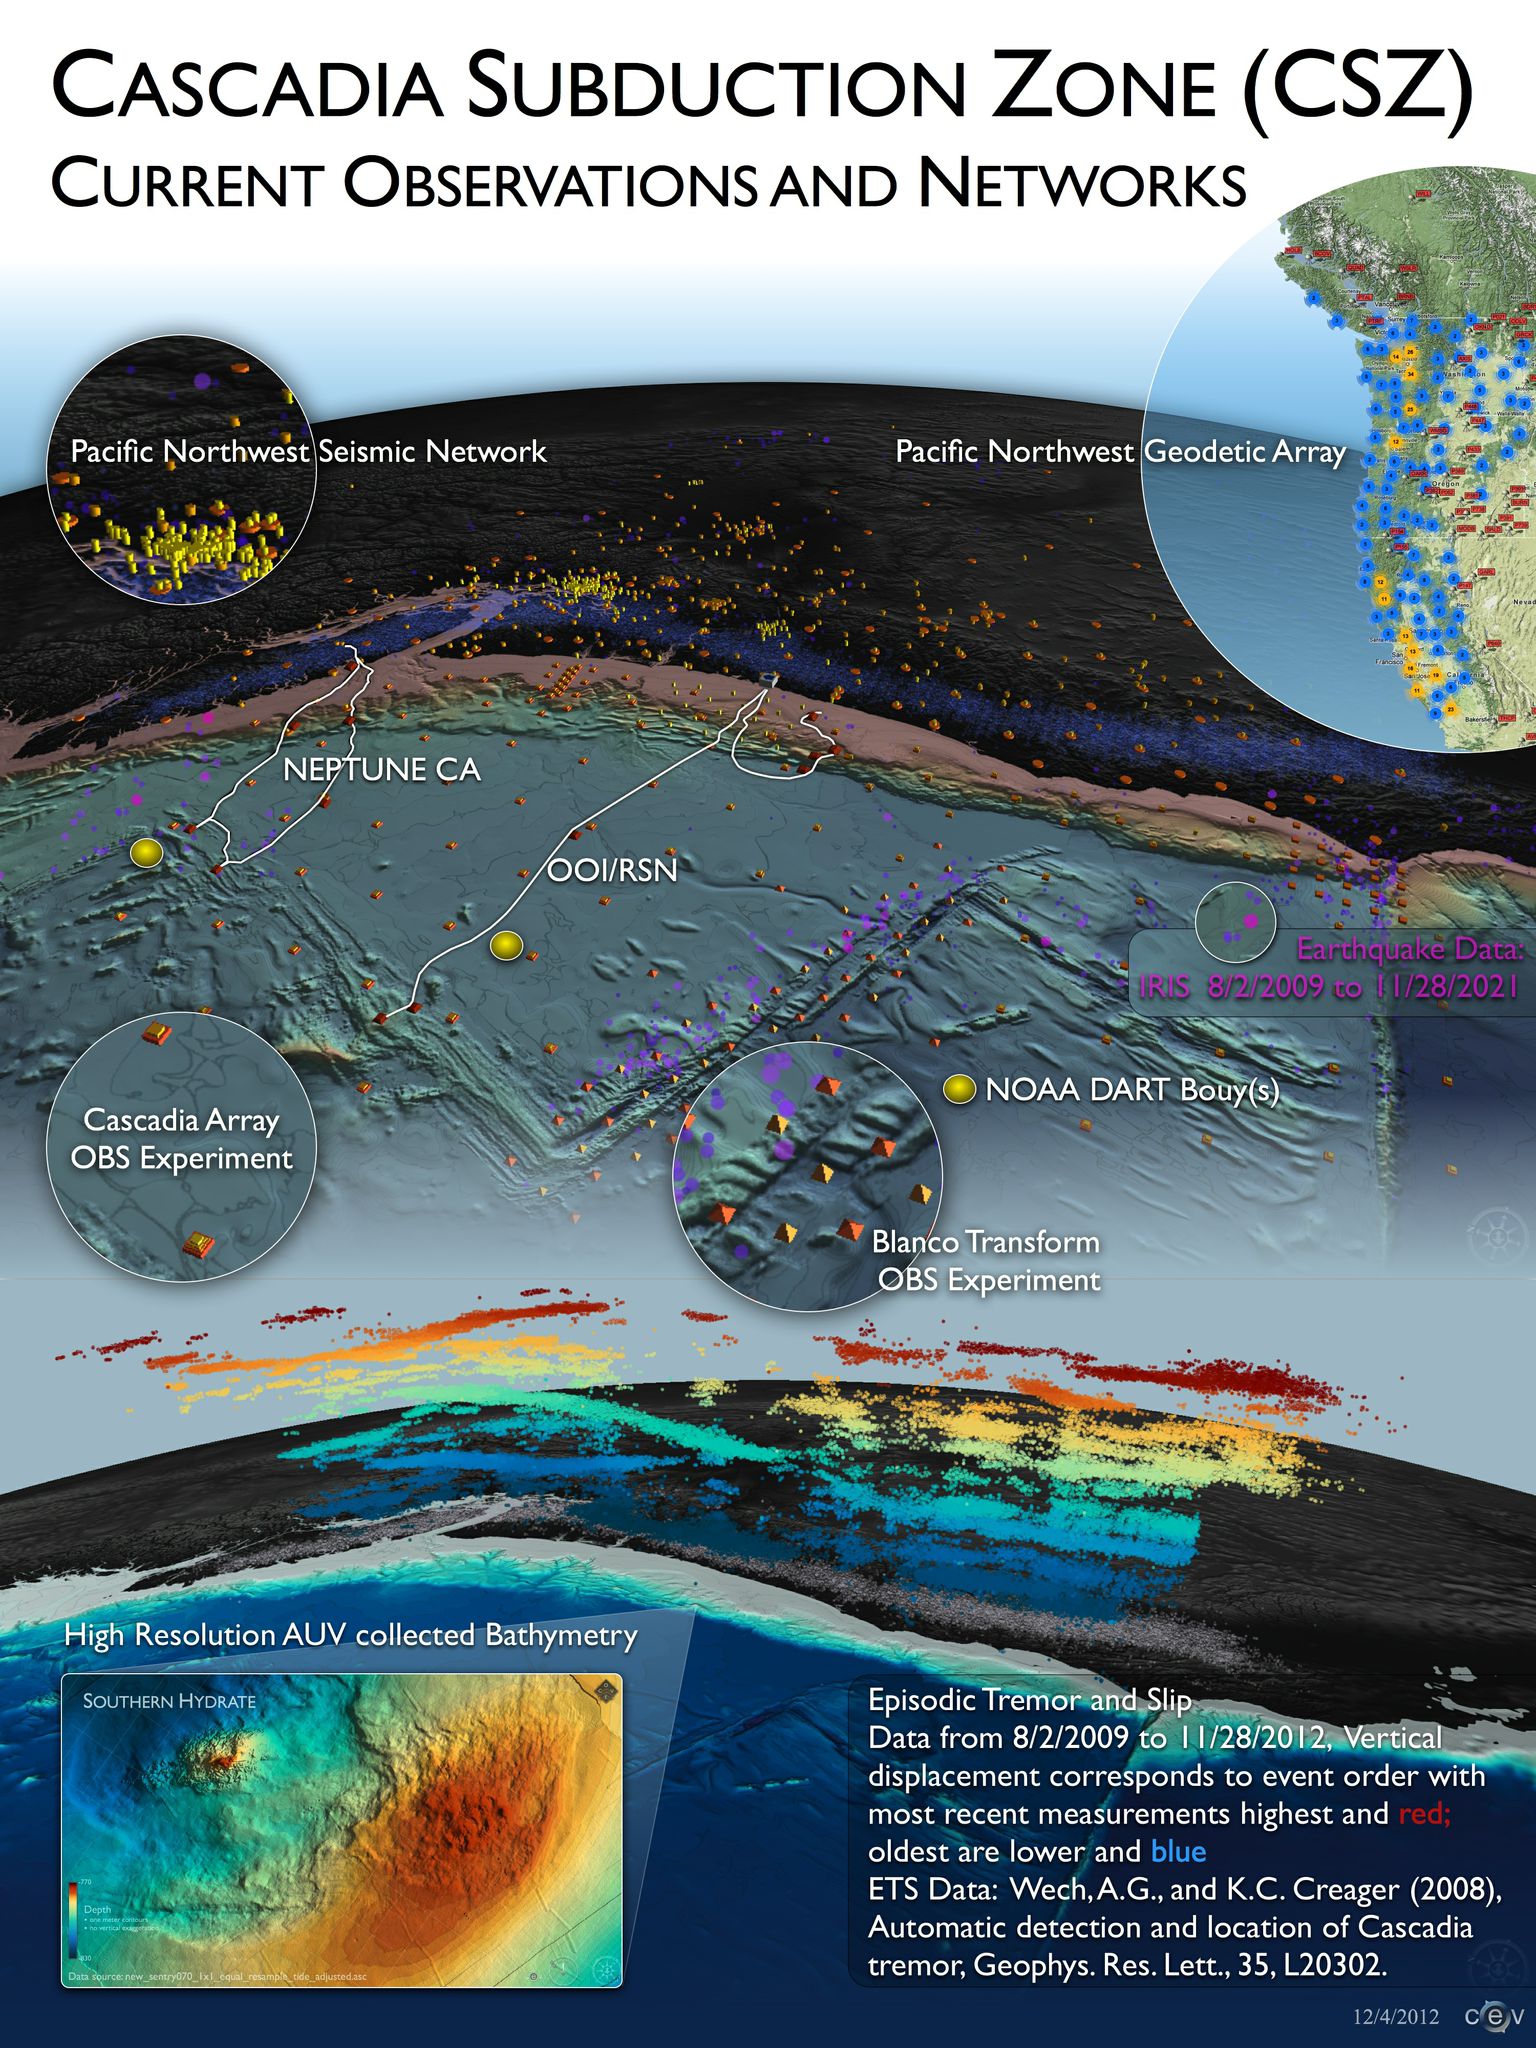
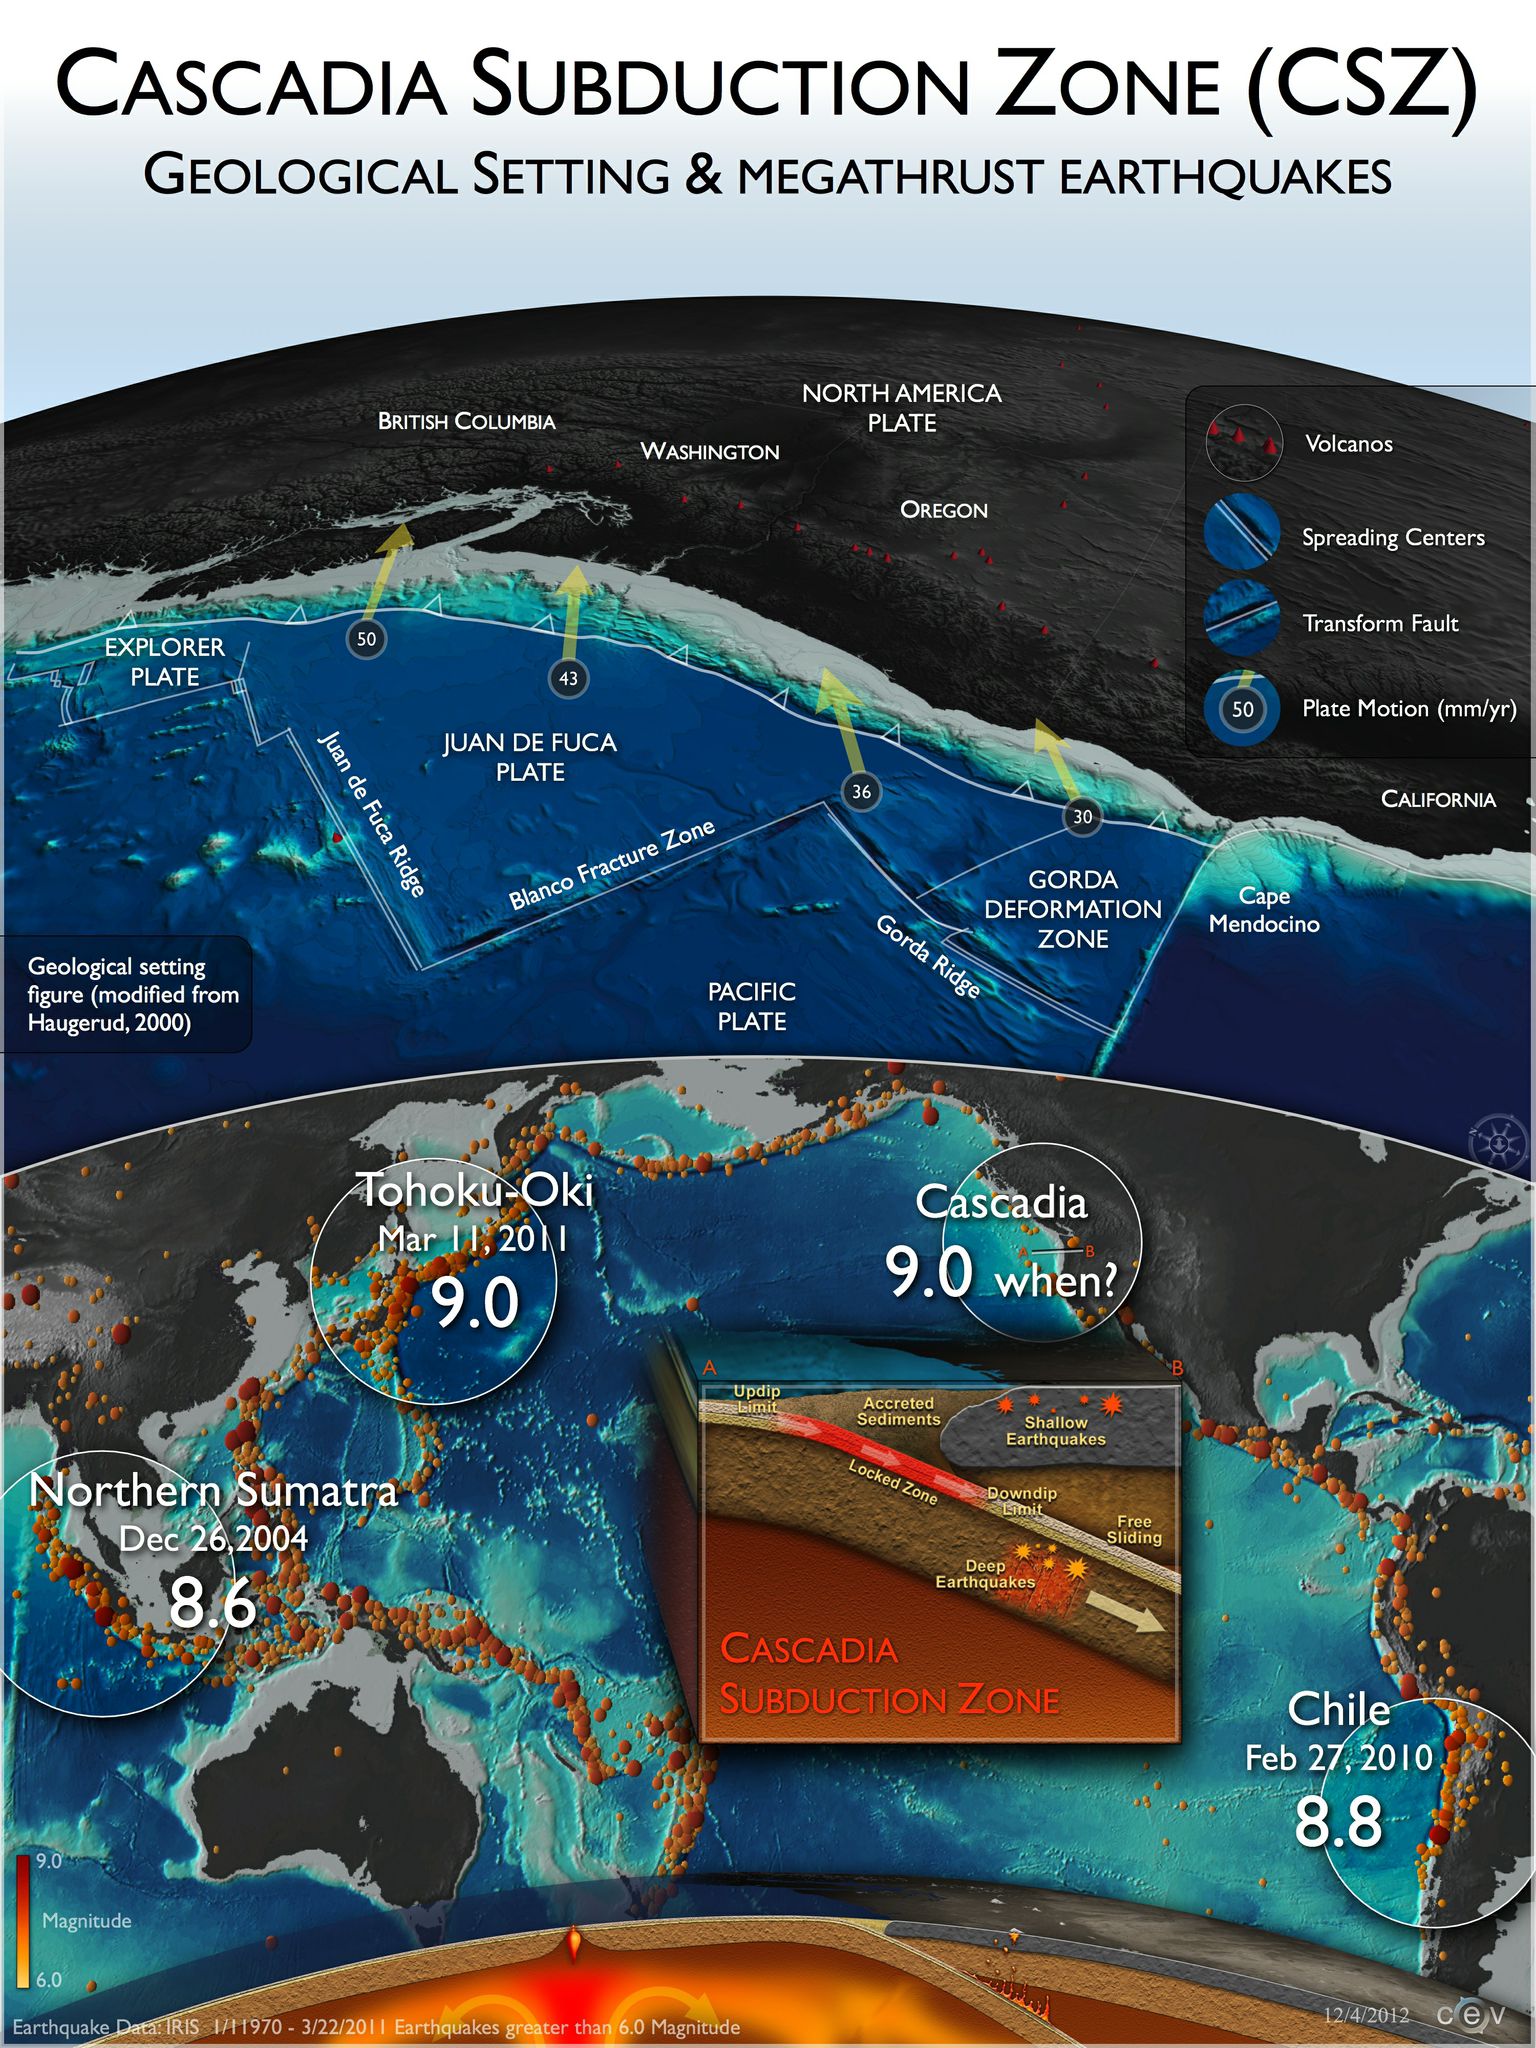
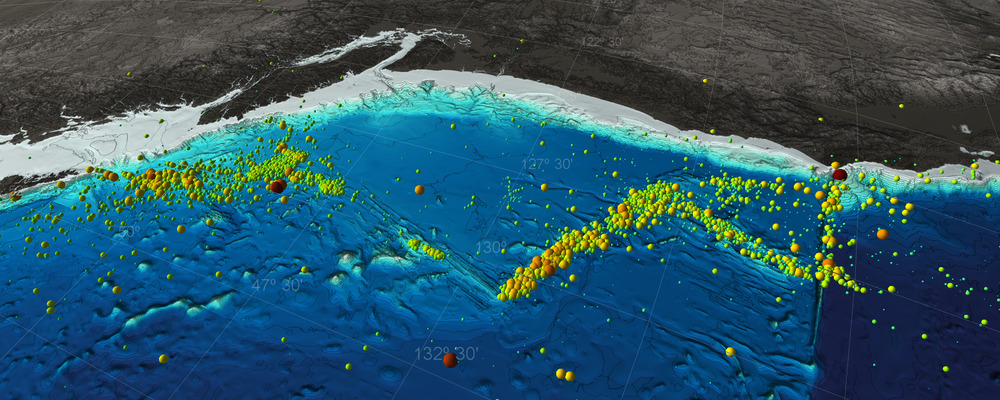
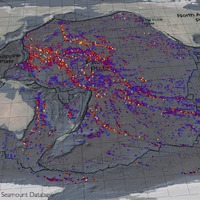
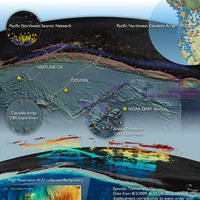
    The Pacific Northwest with geological features, political boundaries, and existing onshore geophysical instrumentation labeled.  Link

    ×
  • Exploring the Mariana Trench

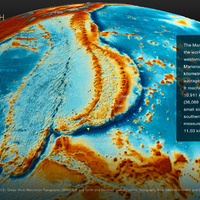
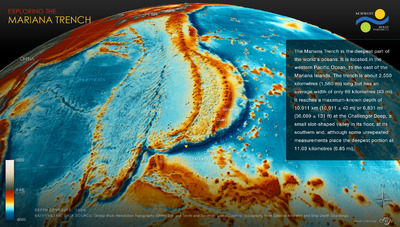
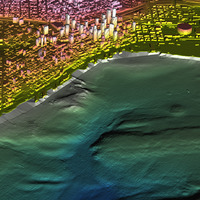
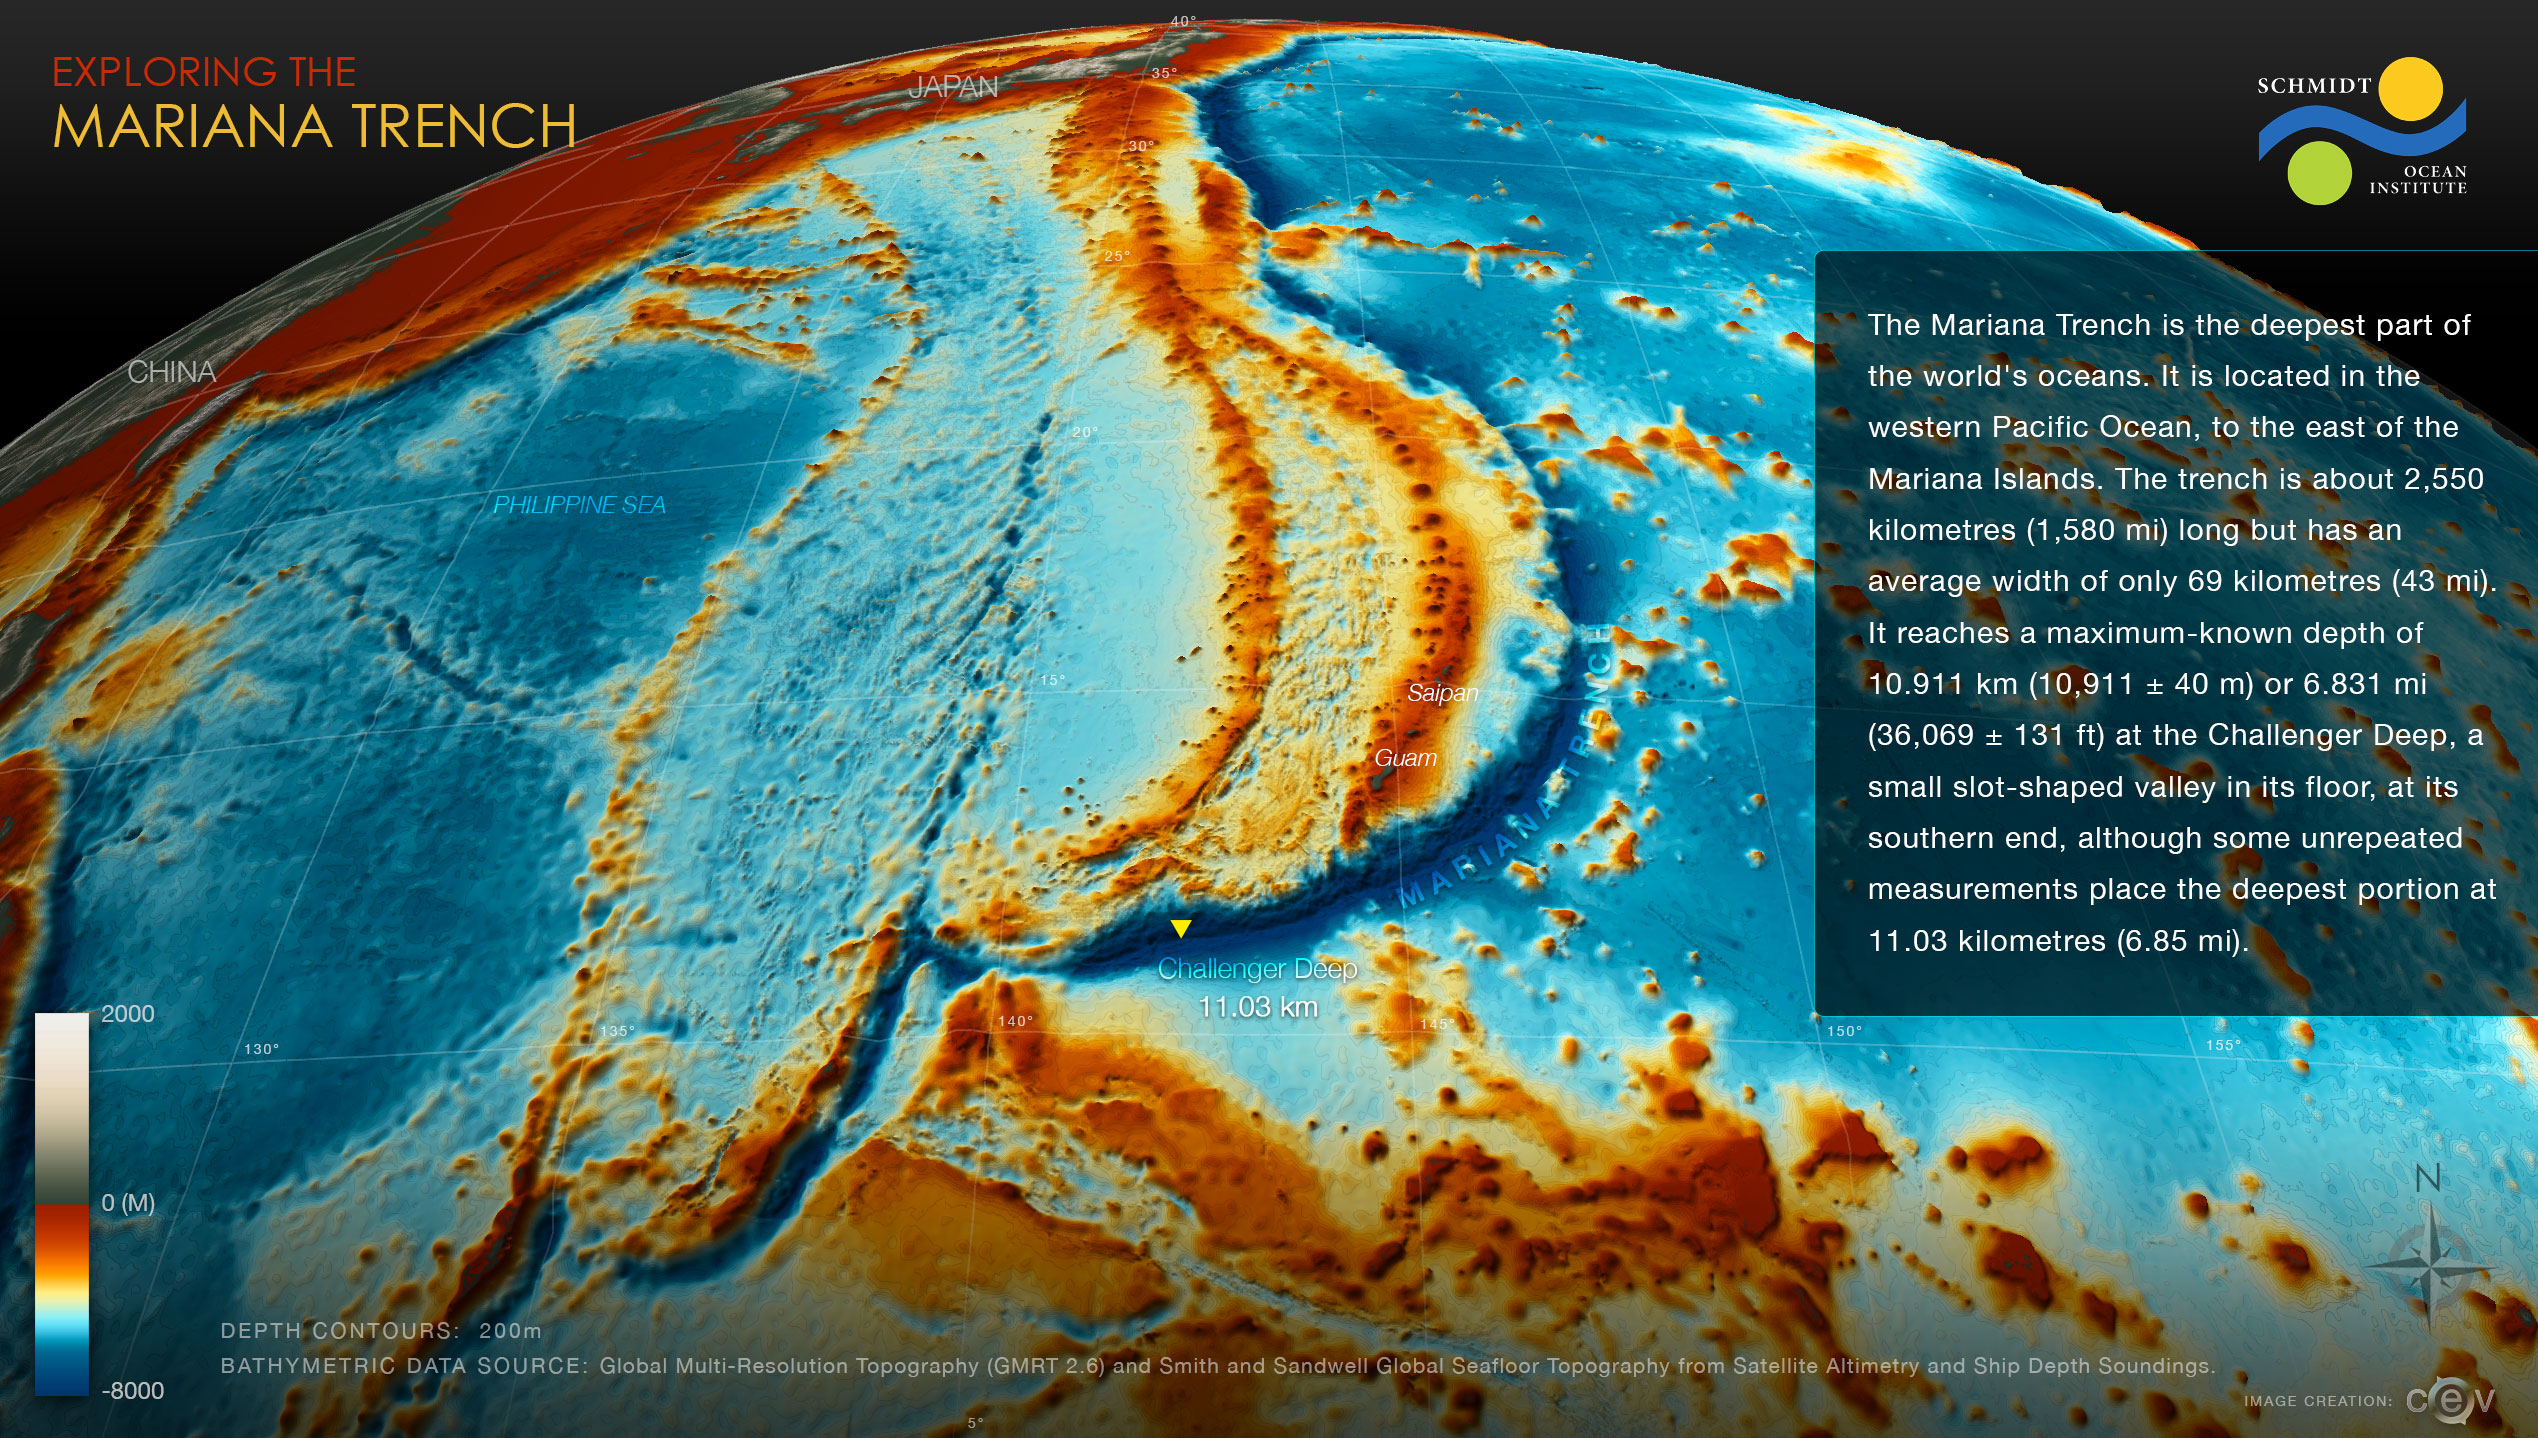
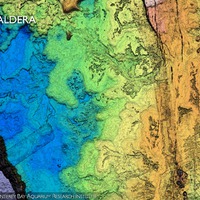
    The Mariana Trench is the deepest part of the world's oceans.  It is located in the western Pacific Ocean, to the east of the Mariana Is Link

    ×
  • Atlantis Masiff

    Atlantis Massif on the mid-Atlantic spreading center Link

    ×
  • Internal wave energy fluxes in the South China Sea

    Internal wave energy fluxes in the South China Sea Link

    ×
  • Landcover Visualization of Union Basin

    Landcover Visualization of Union Basin Link

    ×
  • Snohomish River Basin Sediment Thickness

    Snohomish River Basin Sediment Thickness Link

    ×
  • Overview of internal waves in the South China Sea

    Overview of internal waves in the South China Sea Link

    ×
  • Main Endeavor Vent Field

    Main Endeavor Vent Field with cross-section Link

    ×
  • ROMS Model Temperature Output

    ROMS Model Temperature Output Link

    ×
  • Global Seamounts

    Visualization of plate boundaries and global seamounts Link

    ×
  • AXIAL Caldera Bathymetry

    Visualization of AXIAL Caldera Bathymetry Link

    ×
  • Bathymetry of Southern Hydrate

    Bathymetry of Southern Hydrate Link

    ×
  • Max Flow Velocity from VIC Model

    Max Flow Velocity from VIC Model Link

    ×
  • Cascadia Array

    Cascadia Array deployment of Seismometers and IRIS Earthquake data Link

    ×
  • COVE Visual

    Informatics Link

    ×
  • Age of Seafloor

    Age of Seafloor Link

    ×
  • Cascadia Subduction Zone

    Cascadia Subduction Zone Link

    ×
  • TRMM Precipitation Data

    TRMM Precipitation Data for January 2012 Link

    ×
  • Climate Impacts Science

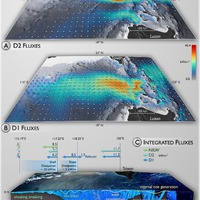
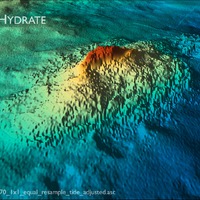
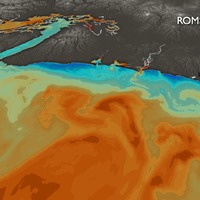
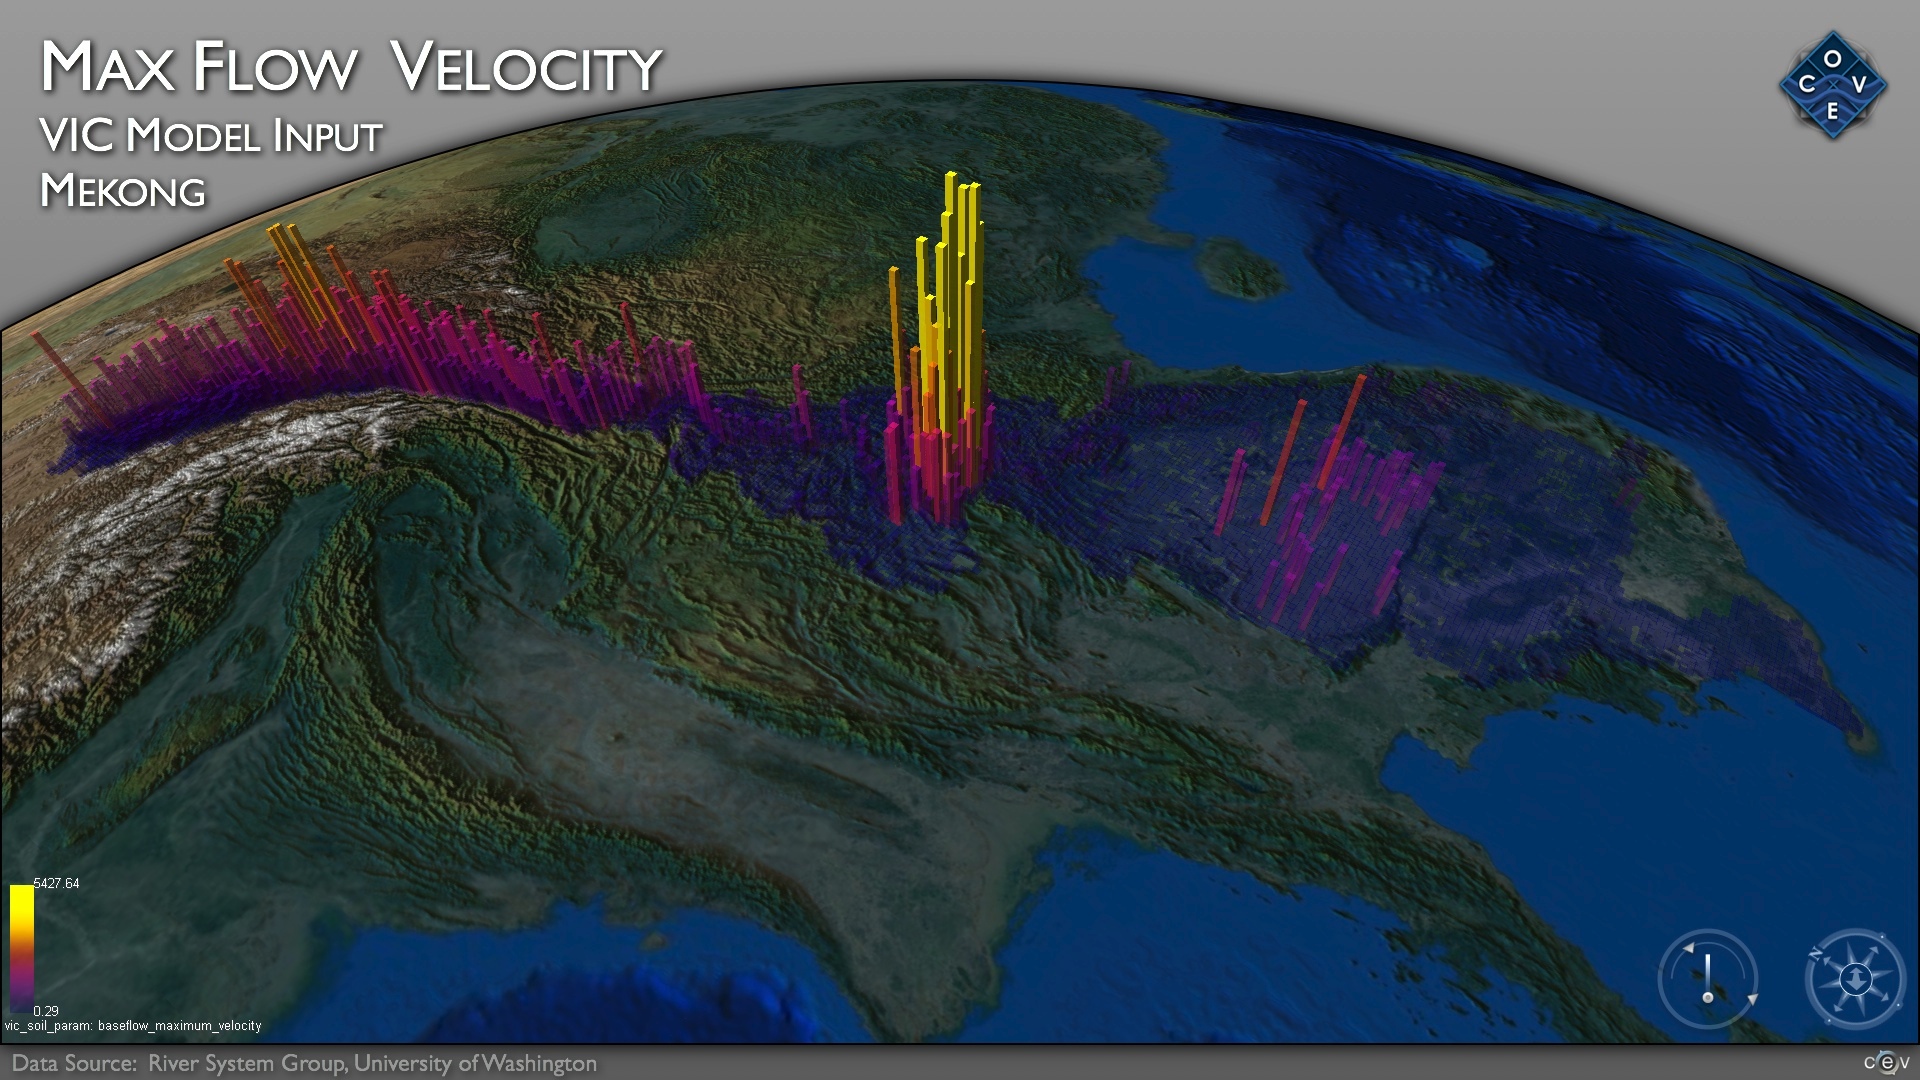
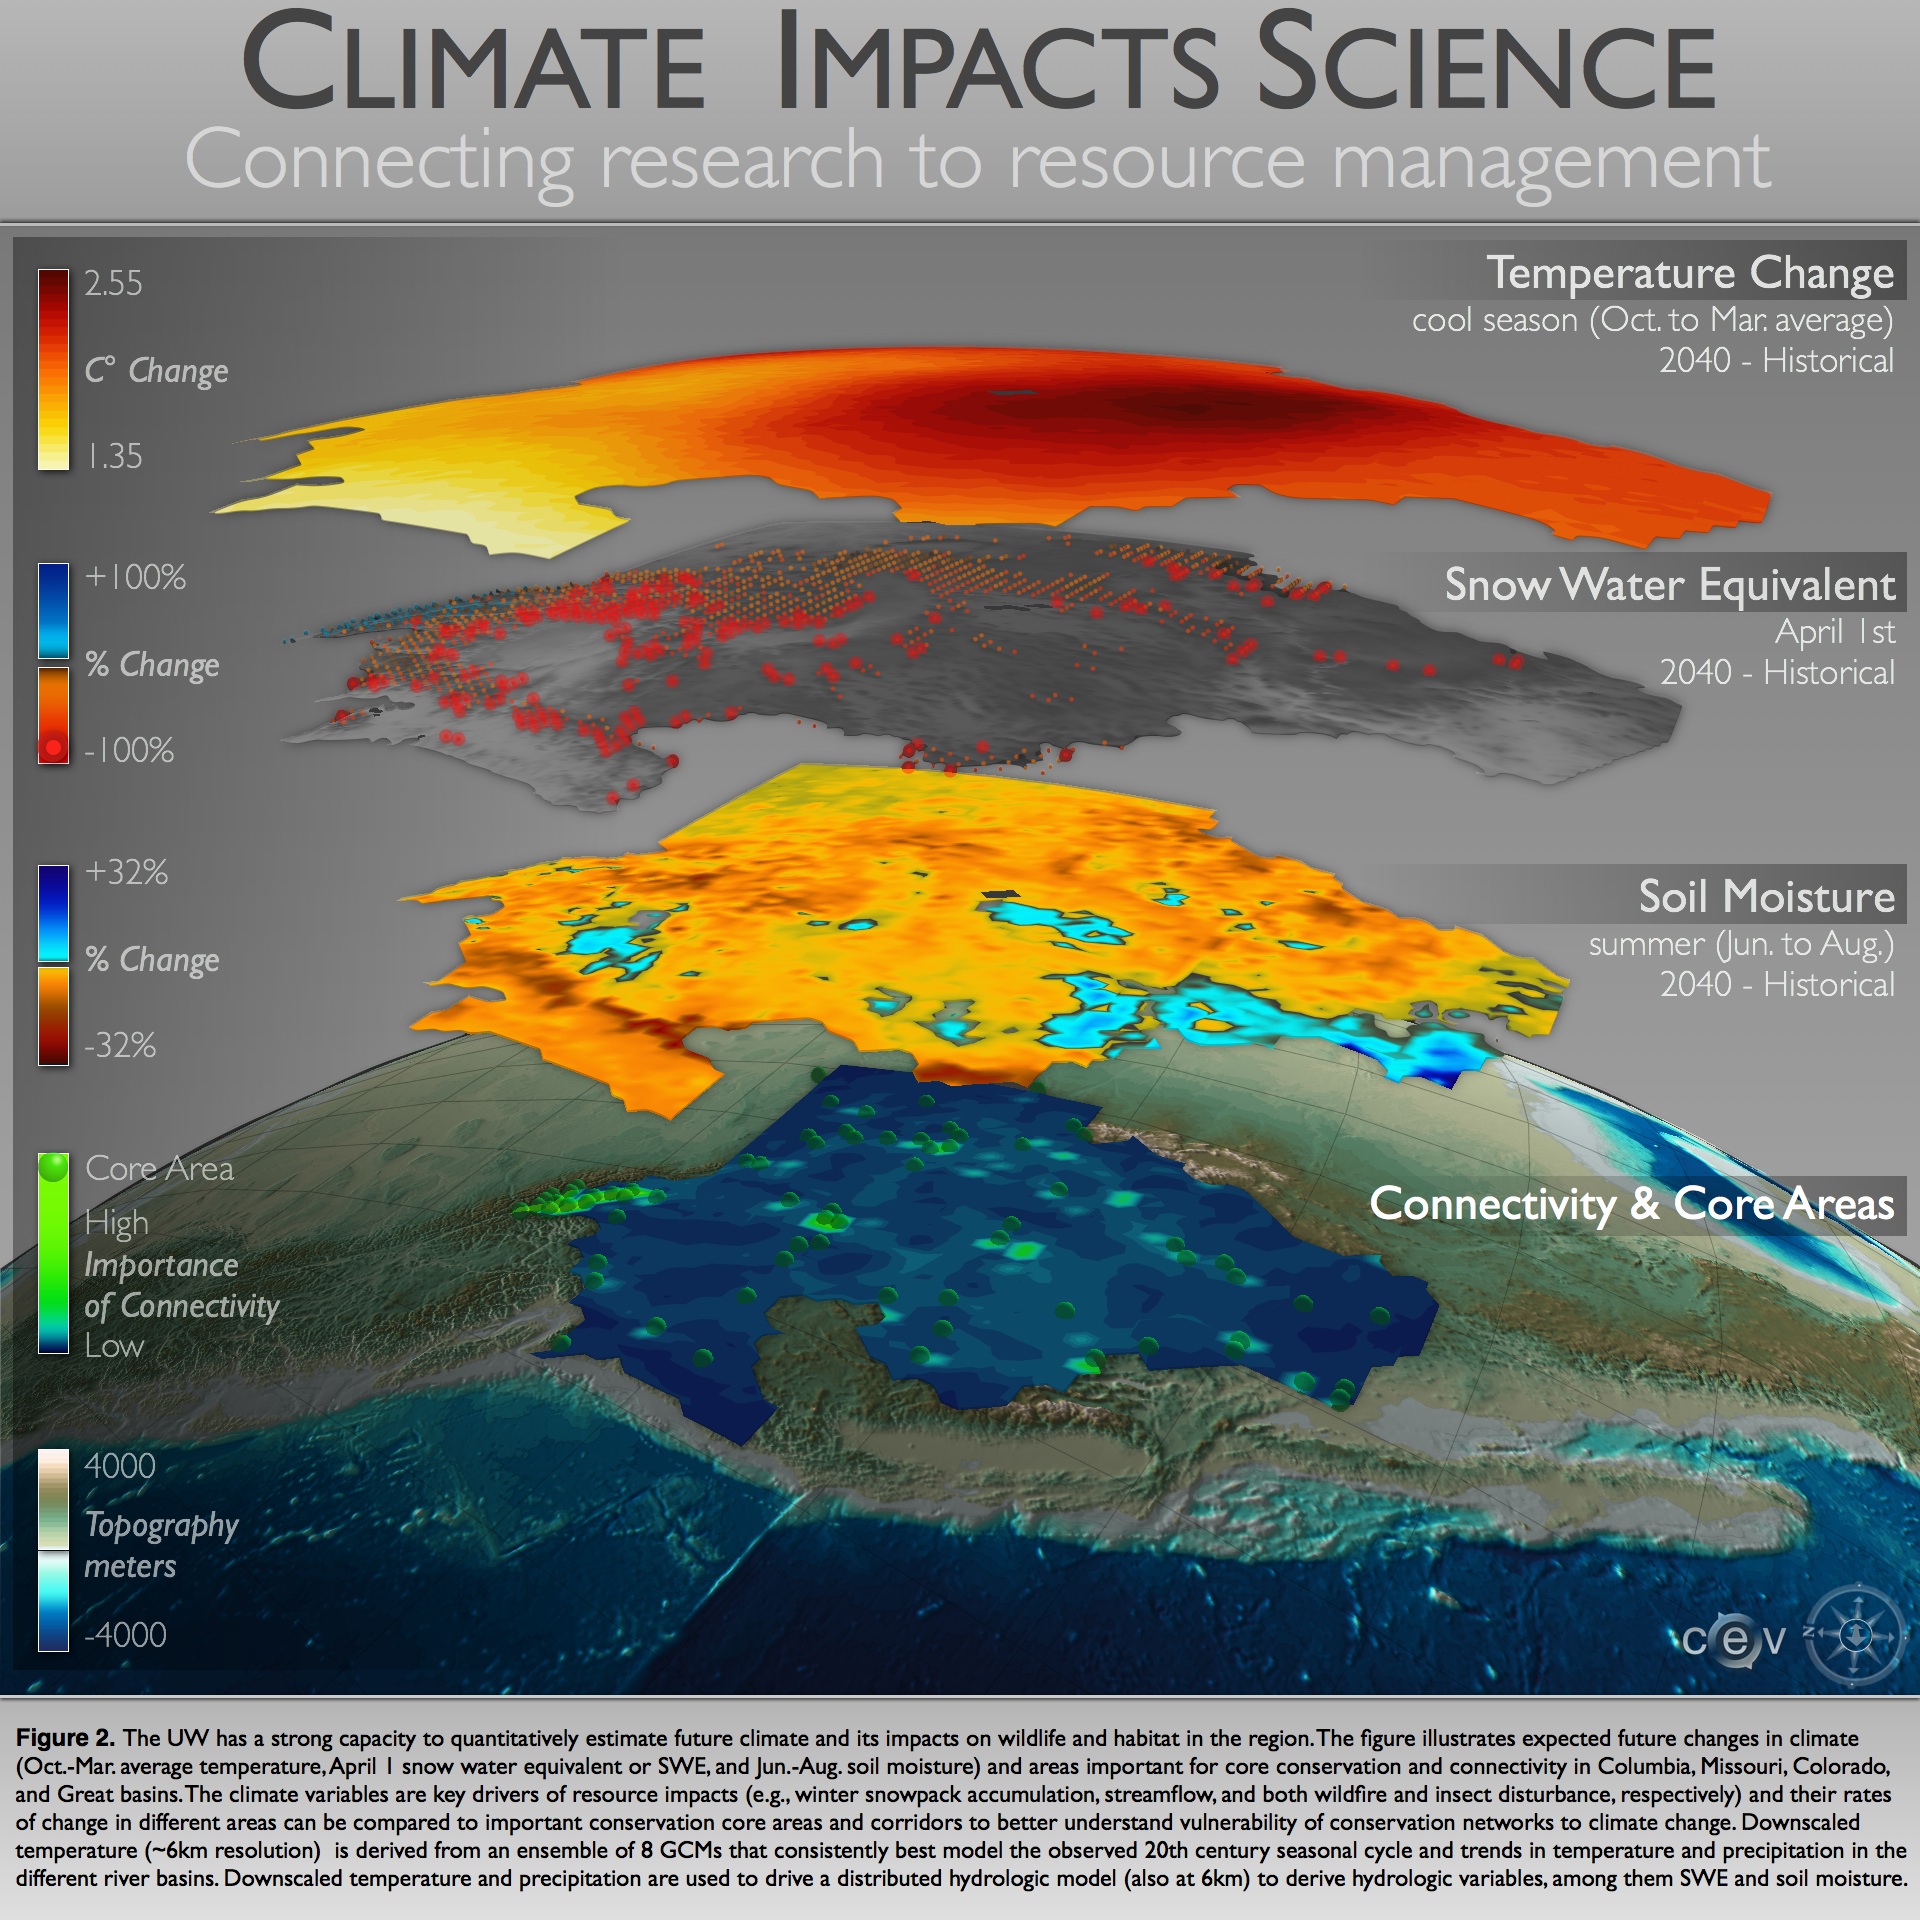
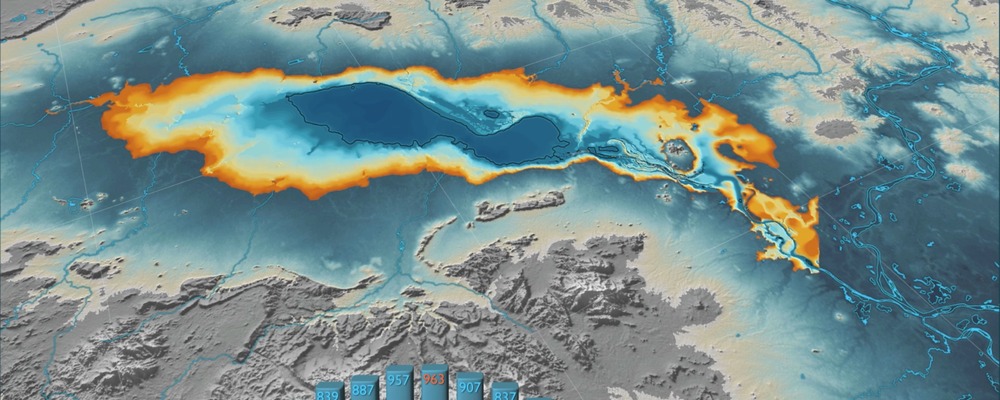
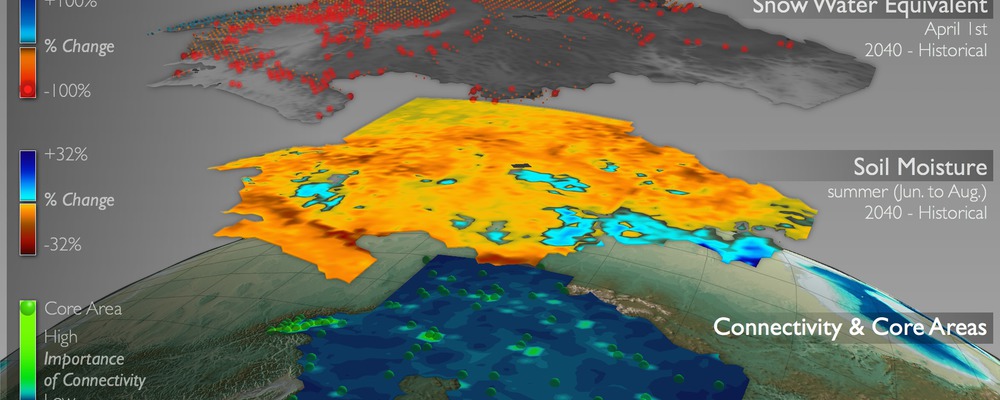
    CEV worked with the University of Washington Climate Impact Group to generate a figure visualizing climate change Link

    ×
  • Total Dissolved Nitrogen Stream Chemistry Comparison

    Total Dissolved Nitrogen Stream Chemistry Comparison Link

    ×
  • COVE Image DHSVM Simulation NO3

    COVE Image: DHSVM Simulation NO3 Link

    ×
  • Elliott Bay Topography

    Elevation of downtown Seattle and bathymetry of Elliot Bay Data provided by David Finlayson (now with USGS) Link

    ×