Copyright © Center for Environmental Visualization| ALL RIGHTS RESERVED.
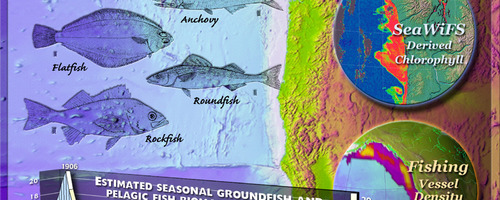
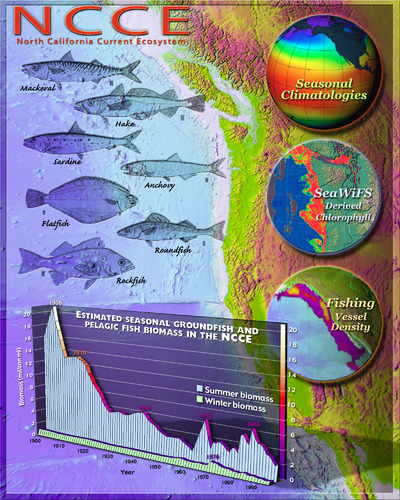
This illustration was a cover for a Seagrant proposal focused on the North California Counter Current. Elements of the illustration include North East Pacific fish prints, a graph of biomass for the last hundred years, and visualizations of sea surface temperature, Sea WiFS Chlorophyll data and fishing vessel density from the HITS database.
CEV collaborated on this illustration with Robert Francis, School of Aquatic & Fishery Sciences, University of Washington.
Visualizations were done with IRIS Explorer, the graph with Microsoft Excel, and the image composited with Photoshop.